HP Insight Cluster Management Utility
Copyright 2013 Hewlett-Packard Development Company, L.P
Contents
Defining a cluster with HP Insight CMU
Provisioning a cluster with HP Insight CMU
Monitoring a cluster with HP Insight CMU
Advanced topics 112
Managing a cluster with HP Insight CMU
Actions Alerts Alert reactions
Support and other resources 123
Troubleshooting 126
Detailed installation instructions 131
HP Insight CMU manpages 139
Glossary 187 Index 189
Figures
Tables
Date command Dmidecode command
Examples
Overview
Features
HP Insight CMU configuration
Compute node monitoring
Compute node administration
System disk replication
Installing HP Insight CMU
Installing and upgrading HP Insight CMU
Management node hardware requirements
Configuring the local smart array card
Planning for compute node installation
Firmware upgrade requirements
Configuring the management cards
7.1 DL3xx, DL5xx, DL7xx, Blades
Configuring the Bios
NIC 1 PXE boot or PXE enabled NIC 2 Disabled
Speed 9600 Bd
7.2 DL160 G5, DL165c G5, DL165c G6, and DL180 G5 Servers
IDE
NIC1 control Enabled
Share NIC mode Disabled
Dhcp Disabled
NIC1 PXE Enabled
7.4 SL2x170z G6 and DL170h G6 Servers Bios setting
NIC2 on the SL2x170z G6 Server
Preinstallation limitations
Preparing for installation
HP Insight CMU kit delivery
HP Insight CMU CD-ROM directory structure
Operating system support
Rhel 6 support
Login privileges
HP Insight CMU installation checklist
SELinux and HP Insight CMU
Run /opt/cmu/bin/cmumgtconfig -c
Installation procedures
# chkconfig --add cmu
Installing HP Insight CMU with high availability
Installing and upgrading HP Insight CMU
Software prerequisites
Installing HP Insight CMU under HA
HA hardware requirements
Overview
HP Insight CMU HA service requirements
Configuring HA control of HP Insight CMU
Installing and testing
Start cmuserver
Cmuadmin1# /etc/init.d/cmu start
# /etc/init.d/cmuserver start
Cmuadmin2# /opt/cmu/tools/cmuhapostinstall
Cmu hacmu service needs restart
Var/log/cmuservicehostname.log file for errors
# /etc/init.d/cmu setaudit # /etc/init.d/cmu stop
Cmuha nothing to backup from the cmu HA share
HP Insight CMU configuration considerations
Upgrading HP Insight CMU HA service
Run cmuhapostinstall on server
Dependencies
Stopping the HP Insight CMU service
Upgrading HP Insight CMU
Upgrading Java Runtime Environment
Saving the HP Insight CMU database
Restoring the HP Insight CMU database
Launching the HP Insight CMU GUI
HP Insight CMU service status
Defining a cluster with HP Insight CMU
HP Insight CMU main window
Click Options→Unprivileged Mode
Administrator mode
Quitting administrator mode
Server requirements
High-level checklist for building an HP Insight CMU cluster
Cluster administration
Node management
Node management window
Scanning nodes
Scan node dialog
Management card password window
Adding nodes
Cluster Administration→Node Management
Modifying nodes
Deleting nodes
Network entity management
Importing nodes
Exporting nodes
Adding network entities
Deleting network entities
Provisioning a cluster with HP Insight CMU
Logical group management
Deleting logical groups
Modifying logical groups
Renaming logical groups
Autoinstall templates
Autoinstall
Autoinstall requirements
Autoinstall calling methods
Creating an autoinstall logical group
Using autoinstall from GUI
Enabling autoinstall
Restart cmuserver
Autoinstall compute nodes
Registering compute nodes
Adding nodes to autoinstall logical group
Using autoinstall from CLI
Registering an autoinstall logical group
Cmu addtologicalgroup node to logicalgroupname
Where nodes.txt is the list of nodes to autoinstall
Customization
Restrictions
Backing up
Backing up a disk from a compute node in a logical group
# /opt/cmu/image/logicalgroupname
Cloning procedure
Cloning
Preconfiguration
Cloning status
Reconfiguration
Default content of prereconf.sh is
Node static info
Rescan MAC
After editing the image, commit changes
HP Insight CMU image editor
Expanding an image
# cmuimagecommit -i rh5u4x8664
Saving a modified cloning image
HP Insight CMU diskless environments
Modifying an image
# /opt/cmu/bin/cmuimagecommit -i rh5u4x8664
On the management node
Modifying the Tftp server configuration
Operating systems supported
On the golden node
Creating a diskless image
Activating the diskless feature
Populating the HP Insight CMU database
Creating a diskless logical group
Adding a new logical group
# /opt/cmu/cmucli
Adding nodes into the logical group
From the CLI
Cmu probekernel
Understanding the structure of a diskless image
Booting the compute nodes
Cmu boot net myTestImage node1 noden
Customizing your diskless image
Using reconf-diskless-image.sh
Templates and image file
Do not update the /opt/cmu/image/imageName/root directory
Best practices for diskless clusters
Node. /opt/cmu/image/imageName/snapshot/nodeName
# chkconfig nfs on
Configuring additional NFS servers
On Red Hat
On Sles
When a diskless logical group is created
# chkconfig nfsserver on
Sample file
When a node is added to the diskless logical group
Comments on High Availability HA
Monitoring a cluster with HP Insight CMU
Installing the HP Insight CMU monitoring client
Deploying the monitoring client
Monitoring the cluster
Launch the HP Insight CMU GUI
Node and group status
Selecting the central frame display
Global cluster view in the central frame
Monitoring window
Resource view in the central frame
Resource view overview
Gauge widget
Detail mode in resource view
Node view in the central frame
Using time view
Node details
Tagging nodes
Getting started
Adaptive stacking
Bindings and options
Mouse control
Troubleshooting
Technical dependencies
Archiving user groups
Visualizing history data
Action and alert files
Tuning HP Insight CMU monitoring
Stopping HP Insight CMU monitoring
Limitations
Actions
Alerts
Alerts
Alert reactions
Level of the alert
Name of the alert that caused the reaction
Text of the Description for this reaction
# chkconfig --add collectl
Using collectl for gathering monitoring data
Installing and starting collectl on compute nodes
# /etc/init.d/collectl start
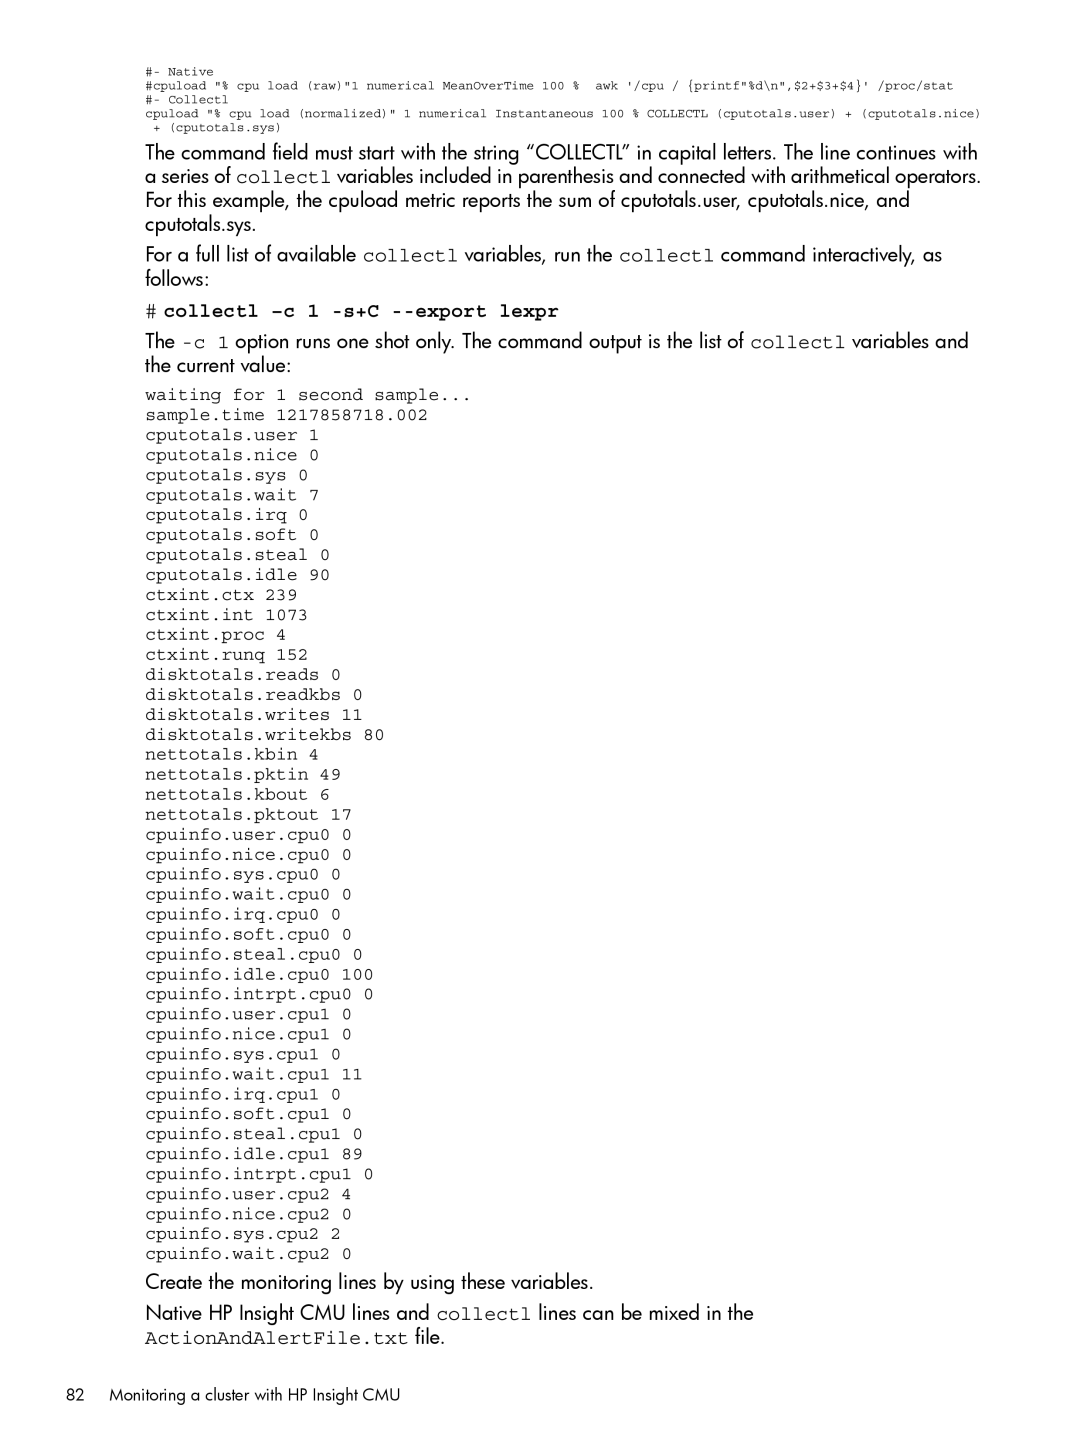
# collectl -c 1 -s+C --export lexpr
ActionAndAlertFile.txt file
# exportfs -r
# mkdir /var/log/collectl # vi /etc/exports
Var/log/collectl *rw,sync,noallsquash,norootsquash
# cp -a /var/www/html/colplot /opt/cmu/www/colplot
Restart collectl
# mkdir /var/log/collectl # vi /etc/fstab
# vi /etc/collectl.conf
# /etc/init.d/collectl restart
Monitoring Nvidia GPUs
Monitoring GPUs and coprocessors
Select plotting options, then click Generate Plot
# cmuconfigamd
Monitoring AMD GPUs
Monitoring Intel coprocessors
Review the results and verify no errors are reported
# /opt/cmu/bin/cmuconfigintel
Extended metric support
HP Insight CMU alert converted to SIM event
Opt/cmu/bin/cmusubmitextendedmetrics -f datafile
Unprivileged user menu
Administrator menu
Managing a cluster with HP Insight CMU
SSH connection
Virtual serial port connection
Power off
Management card connection
Shutdown
Reboot
Boot
Change UID LED status
Single window pdsh
Multiple windows broadcast
Dshbak
Cmudiff examples
Cmupdsh cmudiff -h
Cmupdsh dmidecode
Cmupdsh cmudiff -d
# vi /root/.ssh/config
Parallel distributed copy pdcp
User group management
Adding user groups
Deleting user groups
Viewing and analyzing Bios settings
HP Insight firmware management
Renaming user groups
Installing and upgrading firmware
Checking Bios versions
Customizing the GUI menu
HP Insight CMU CLI
Saving user settings
Basic commands
Starting a CLI interactive session
For example, to get more information about the halt command
Help commands
Getting help for a command
Cmu help
Displaying logical groups of a cluster
Executing a command on one node
Specifying nodes
Displaying nodes of a logical group
Using wildcards
Executing a command on a list of nodes
Executing a command on a range of nodes
Executing a command on all nodes
Booting a set of nodes
Administration and cloning commands
Executing a command on specific nodes of a logical group
Broadcasting commands to a set of nodes
Powering off a set of nodes
Rebooting a set of nodes
Halting a set of nodes
Cmu locate on o185i192
Setting the locator LED on or off
Cloning a set of nodes
Cmu locate off o185i192
Adding nodes to a logical group
Adding a new logical group
Backing up a node
Cmu backup
Cmu modifypassword lo100i
Modifying a management card password
Cmu modifypassword ILOILOCMlo100i
Discovering MAC address for new nodes
# /opt/cmu/bin/pdcp -w cn0001,cn0002 source /tmp/dest
Administration utilities pdcp and pdsh
HP Insight CMU Linux shell commands
# /opt/cmu/bin/pdsh -w cn0001,cn0002 ls
Accessing the GUI for non-root users
Advanced topics
Configuring sudo support
Custom menu options for non-root users
Sbarney ALL = Nopasswd Cmupower Cmuimage Cmuetc
Cjones ALL = Cmupower
Bstevens ALL = Nopasswd Cmupower Cmuimage
HP Insight CMU diskless API
Delete diskless image
Build diskless image
Name of the new logical group
Unconfigure diskless node
Configure diskless node
Boot diskless node
Lo100i
HP Insight CMU remote hardware control API
Diskless check
None
Uidoff
Off
Osoff
Uidon
CMUVALIDHARDWARETYPES=ILOlo100iILOCM
CMUVALIDHARDWARETYPES=ILOlo100iILOCMIPMI
Cloning mechanisms
Support for ScaleMP
CMUvSMPPREFIX=vSMP
Cloning mechanisms
Advanced topics
Contacting HP
Support and other resources
Related information
Computer output
Command
Typographic conventions
User input
Typographic conventions
Network boot issues
Troubleshooting
HP Insight CMU logs
Troubleshooting switch issues
Backup issues
Troubleshooting network boot
GUI problems
Cloning issues
Administration command problems
If not, restart the HP Insight CMU service
Certificate error
Detailed Java exception is
Troubleshooting
Activating xinetd services
Detailed installation instructions
Install required RPMs
# chkconfig nfs on # /etc/init.d/nfs start
Verifying the Dhcpd listen interface
Firewall configuration
Java installation
On the HP Insight CMU management node
Configuring the HP Insight CMU management server hostname
Installing HP Insight CMU licensing
Setting the Java Path
Method
Edit the /opt/cmu/etc/cmuserver.conf file
Cmu service needs restart
Starting HP Insight CMU
# vi /opt/cmu/etc/cmuserver.conf
Verifying the HP Insight CMU state
Configuring HP Insight CMU to start automatically
Installing HP Insight CMU on the GUI client workstation
Cmuserver utility reports the state of the daemons
Using an ssh tunnel
Configuring the GUI client on Linux workstations
Using an X Window server
Activating the HP Insight CMU GUI
Launching the HP Insight CMU GUI using a web browser
Launching the HP Insight CMU directly from the Java file
HP Insight CMU GUI
HP Insight CMU manpages
Cmushownodes8
# /opt/cmu/bin/cmushownodes -a -o %n %i %k %m default %b %t
# /opt/cmu/bin/cmushownodes
Help
Cmushowlogicalgroups8
# /opt/cmu/bin/cmushowlogicalgroups -h logicalgroupname
# /opt/cmu/bin/cmushowlogicalgroups
# /opt/cmu/bin/cmushownetworkentities
Cmushownetworkentities8
# /opt/cmu/bin/cmushownetworkentities -h networkentity
# /opt/cmu/bin/cmushownetworkentities rack1
# /opt/cmu/bin/cmushowusergroups
Cmushowusergroups8
# /opt/cmu/bin/cmushowusergroups -h usergroup
# /opt/cmu/bin/cmushowusergroups user1
# /opt/cmu/bin/cmushowarchivedusergroups -p -f
Cmushowarchivedusergroups8
# /opt/cmu/bin/cmushowarchivedusergroups
# /opt/cmu/bin/cmushowarchivedusergroups -f -s
Mgtcardip -T--mgt-card ILOlo100iILOCM -R--arch architecture
Cmuaddnode8
Node-number num
# cat nodes.txt
Command-line mode
Processing 1 node
# /opt/cmu/bin/cmuaddnode -f nodes.txt
# /opt/cmu/bin/cmuaddnetworkentity rack1 rack2
Cmuaddnetworkentity8
Filename inputfile
# /opt/cmu/bin/cmuaddnetworkentity -f networkentitylist
# /opt/cmu/bin/cmuaddlogicalgroup -n test -d cciss/c0d0
Cmuaddlogicalgroup8
Filename inputfile input logical groups from inputfile Name
# /opt/cmu/bin/cmuaddlogicalgroup -f logicalgroupfile
Logicalgroup
Cmuaddtologicalgroupcandidates8
Nodenamefile
# /opt/cmu/bin/cmuaddusergroup user1 user2
Cmuaddusergroup8
# /opt/cmu/bin/cmuaddusergroup -f usergrouplist
# /opt/cmu/bin/cmuaddtousergroup -t group1 cn0003
Cmuaddtousergroup8
Usergroup
# /opt/cmu/bin/cmuaddtousergroup -t group1 -f nodenamefile
Cmuchangeactivelogicalgroup8
To flag cn0001 active in logical group rh6u0x8664
Networkentity
Cmuchangenetworkentity8
# /opt/cmu/bin/cmuchangenetworkentity -t rack1 cn0001
Delete nodes from this logical group
Cmudelfromlogicalgroupcandidates8
Delete one or more nodes from a logical group
To delete one node from a logical group rh6u0x8664
Cmudelfromnetworkentity8
# /opt/cmu/bin/cmudelfromnetworkentity -t rack1 node1
Cmudelarchivedusergroup -- Delete an archived user group
# /opt/cmu/bin/cmudelarchivedusergroup -h -v-t timeout -d
Cmudelarchivedusergroup8
Delete an archived user group
Cmudelfromusergroup8
# /opt/cmu/bin/cmudelfromusergroup -t user1 node1
# /opt/cmu/bin/cmudellogicalgroup rh5u5x8664 sles11sp1x8664
Cmudellogicalgroup8
# /opt/cmu/bin/cmudellogicalgroup -f logicalgrouplist
# /opt/cmu/bin/cmudelnetworkentity rack1 rack2
Cmudelnetworkentity8
# /opt/cmu/bin/cmudelnetworkentity -f networkentitylist
# /opt/cmu/bin/cmudelnode node1 node2
Cmudelnode8
# /opt/cmu/bin/cmudelnode -f nodelist
Cmudelsnapshots8
Delete monitoring snapshots from the history database
# /opt/cmu/bin/cmudelusergroup -f usergrouplist
Cmudelusergroup8
# /opt/cmu/bin/cmudelusergroup user1 user2
# /opt/cmu/bin/cmudelusergroup -a -m 60 -f usergrouplist
Cmuconsole -- Connect to compute node management ports
Cmuconsole8
# /opt/cmu/bin/cmuconsole computenodehostname
Cmupower8
Cmupower -p Boot -l rh6u0x8664
Cmupower -p OFF -n cn0001
Cmupower -p OFF -u user1
Cmupower -p Uidon -u user2
# /opt/cmu/bin/cmucustomrun -l
Cmucustomrun8
Title
# /opt/cmu/bin/cmucustomrun -t auditlspci
# /opt/cmu/bin/cmuclone -f /tmp/nodelist -i sles11sp1x8664
Cmuclone8
=node
# /opt/cmu/bin/cmuclone -n node1 -i rh6u2x8664
Cmubackup -l myimage -n node20 -p cciss/c0d0p3,cciss/c0d0p1
Cmubackup8
Cmubackup -l myimage -n node20 -r 3 -e /tmp/err.log
Options naming
Cmuscanmacs8
# /opt/cmu/bin/cmuscanmacs -h hostname -p hostnameprefix
Options general
Example
Example node definitions
173
# /opt/cmu/tools/cmurescanmac -n nodename N NICnum -h
Cmurescanmac8
Cmurescanmac -- Rescan the MAC address of a node
Node name in the HP Insight CMU database
Filename
Cmumodnode8
Lg logicalgroup
# /opt/cmu/bin/cmumodnode -f nodes.txt
Cmumonstat8
# /opt/cmu/bin/cmumonstat --all-nodes --all-sensors --stats
# /opt/cmu/bin/cmumonstat --nodes=n0001,n0002,n0001-11
# /opt/cmu/bin/cmumonstat --all-sensors --all-nodes
# /opt/cmu/bin/cmumonstat --all-nodes --color
To open the HP Insight CMU image rh5u5x8664
Cmuimageopen8
# /opt/cmu/bin/cmuimageopen -h -i imagename
# /opt/cmu/bin/cmuimageopen -i rh5u5x8664
Cmuimagecommit8
# /opt/cmu/bin/cmuimagecommit -i rh5u5x8664
Cmuconfignvidia8
Cmuconfignvidia -- Configure Nvidia GPU monitoring
Cmuconfigamd8
Cmuconfigamd -- Configure AMD GPU monitoring
Cmuconfigintel -- Configure Intel coprocessor monitoring
Cmuconfigintel8
# /opt/cmu/bin/cmuconfigintel -h -r -n
Eth num1num2bond num1
Cmumgtconfig8
Automatically defaults when reasonable
Num
# /opt/cmu/bin/cmumgtconfig -c -s dhcp
# /opt/cmu/bin/cmumgtconfig -c
# /opt/cmu/bin/cmumgtconfig -t
Ocmudiffparameters
Cmufirmwaremgmt8
Cmufirmwaremgmt -- Verify and execute firmware
Specifies a text file listing compute nodes
Glossary
Ebipa
Package management
Index
Index
191