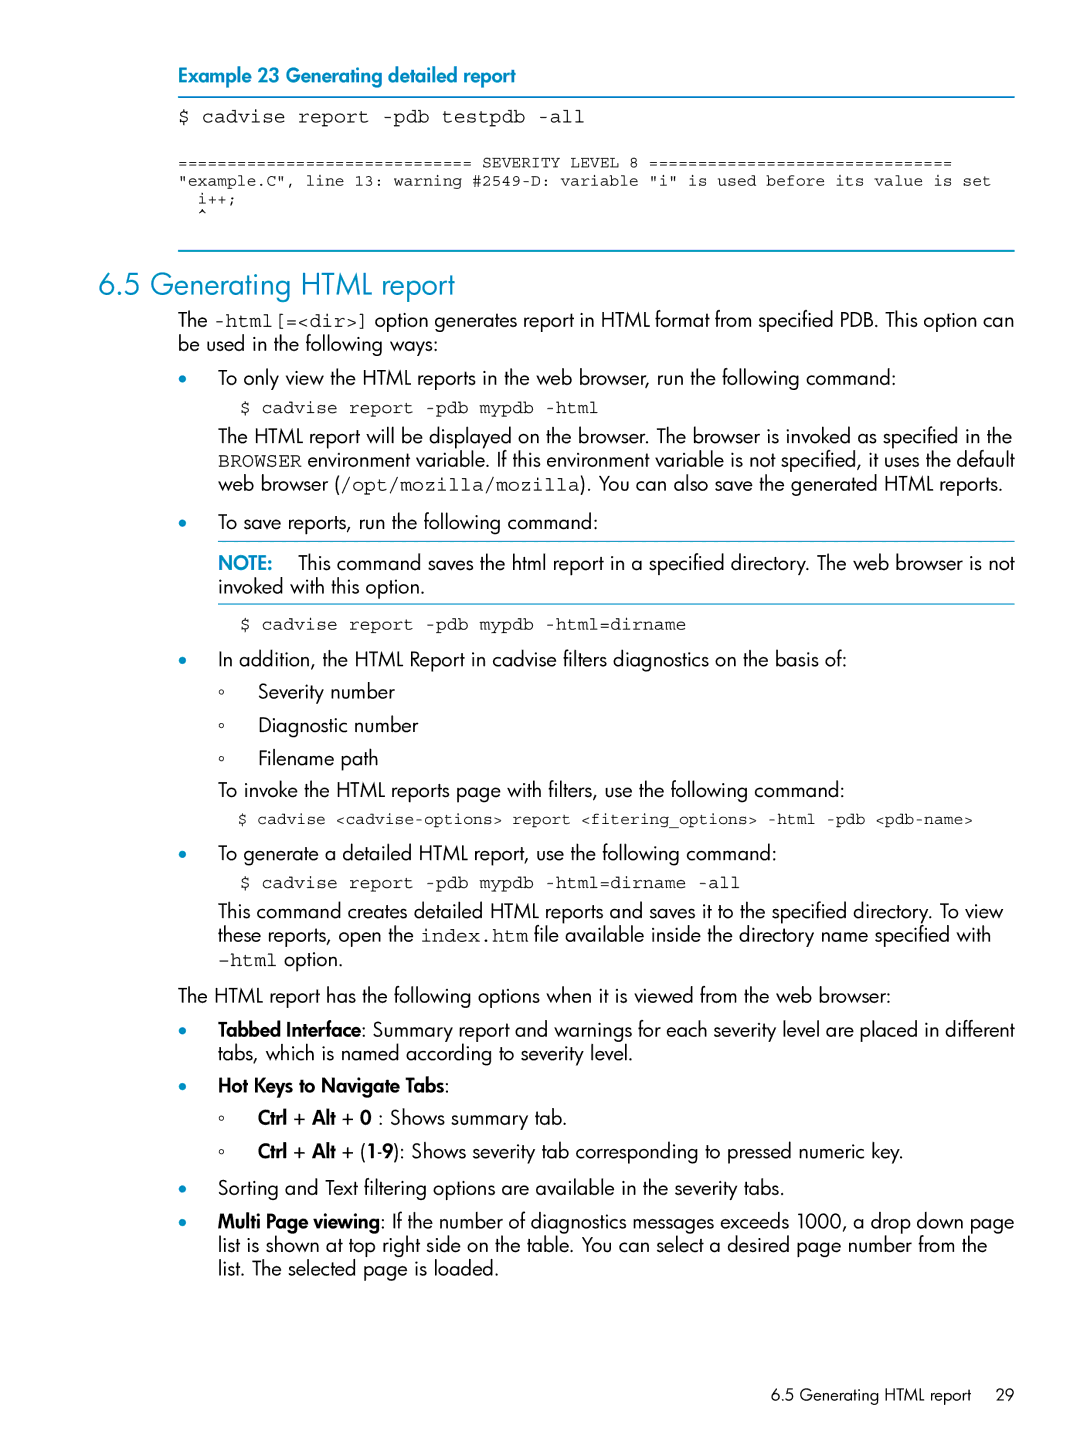
Example 23 Generating detailed report
$ cadvise report -pdb testpdb -all
============================== SEVERITY LEVEL 8 ===============================
"example.C", line 13: warning
^
6.5 Generating HTML report
The
•To only view the HTML reports in the web browser, run the following command: $ cadvise report
The HTML report will be displayed on the browser. The browser is invoked as specified in the BROWSER environment variable. If this environment variable is not specified, it uses the default web browser (/opt/mozilla/mozilla). You can also save the generated HTML reports.
•To save reports, run the following command:
NOTE: This command saves the html report in a specified directory. The web browser is not invoked with this option.
$ cadvise report
•In addition, the HTML Report in cadvise filters diagnostics on the basis of:
◦Severity number
◦Diagnostic number
◦Filename path
To invoke the HTML reports page with filters, use the following command:
$ cadvise
•To generate a detailed HTML report, use the following command: $ cadvise report
This command creates detailed HTML reports and saves it to the specified directory. To view these reports, open the index.htm file available inside the directory name specified with
The HTML report has the following options when it is viewed from the web browser:
•Tabbed Interface: Summary report and warnings for each severity level are placed in different tabs, which is named according to severity level.
•Hot Keys to Navigate Tabs:
◦Ctrl + Alt + 0 : Shows summary tab.
◦Ctrl + Alt +
•Sorting and Text filtering options are available in the severity tabs.
•Multi Page viewing: If the number of diagnostics messages exceeds 1000, a drop down page list is shown at top right side on the table. You can select a desired page number from the list. The selected page is loaded.
6.5 Generating HTML report 29
