XML Files
Page
International Technical Support Organization
First Edition December
Contents
XML Collection
Contents
Part 4. Appendixes
Abbreviations and acronyms
Page
Copyright License
Cics
Trademarks
Team that wrote this redbook
Preface
Page
Comments welcome
Become a published author
Page
Part
Page
XML overview
Background
XML concepts
Information sharing
XML business benefits
XML within an organization
XML in new innovations
Technical benefits of XML
Voice XML
Scalable Vector Graphics
Uniformity and conformity
Acceptability of use for data transfer
Simplicity and openness
Separation of data and display
Industry acceptance
XML history
Extensibility
XML1.0
Xslt and Web applications
Web Tier
Web services and XML
XML, W3C, and IBM
Interaction of Web services
Working drafts in development
Recommendations
Page
Technologies in XML
Tree-based parsing
XML Processor parser
Event-based parsing
DTD and XML Schema
Page
Schema and style using CSS, XSLT, and XSL
Cascading Style Sheet CSS
Example 2-1 a namespace example
XML namespaces
Example 2-2 a namespace example using namespace prefix
Link and jump using XLink, XPointer, and XML Base
Example 2-3 a simple link
Example 2-4 An extended link
XML Base
Example 2-5 An example of extended links using xbase
XML Pointer
XPointer paths and steps
XPointer range functions
XPointer string functions
Example 2-6 An XPath example
XPath
Book Library
XML digital
Technologies in XML
Example 2-8 Encrypted Information on passenger John Smith
Examples of XML encryption
Example 2-7 Information on passenger John Smith
Example 2-10 Encryption of the whole document
Example of a XML digital signature
Example 2-9 Encrypting only the credit card number
Example 2-12 Part encryption of an XML document
Transforms
Example 2-11 An XML digital signature
Example 2-13 The final XML document after encryption
XML query language
Other security specifications
Path expressions
Element constructors
Conditional expressions if then Else
FLWRFOR, LET, Where and Return clauses expression
Filtering
Quantifiers
Querying relational data
Example schema for relational database and Xquery comparison
Joins
Grouping in XQuery
Xslt interpreters
Xslt compilers Xsltc
For more details, visit Using XSLTCThe Apache XML Project at
Cocoon
Java Architecture for XML Binding Jaxb
Serializer pipeline outputs
Generators and reader pipeline inputs
Transformers and actions processing steps
Example 2-14 Sample sitemap for Cocoon
Matchers and selectors conditional processing
Sitemap
Example 2-15 Components of a sitemap XML file
Part 2 XML technology in IBM WebSphere
Page
Processing XML
XML applications
Xalan model of operation
Xalan
Javax.xml.transforms interfaces operation
SAX2
Example 3-2 Sample event breakdown
Example 3-1 Sample XML document
SAX2 classes and interfaces
Example 3-4 Sample namespace
XML namespace support
Example 3-3 SAX2 callback methods
DOM hierarchy
DOM level2
Example 3-5 Sample XML document
Sample generated DOM tree
Jaxp
Example 3-6 Sample XML to Html transformation code
Using Jaxp
Xslt support packages in Jaxp
Stylesheet compilation
Introduction to IBM WebSphere Application Developer
WebSphere Studio family
WebSphere Studio product family
WebSphere Studio Application Developer
WebSphere Studio Site Developer Advanced
WebSphere Enterprise Developer
WebSphere Studio Application Developer Integration Edition
Web development tools
Tools
XML tools
Relational database tools
Java development tools
Web services development tools
Debugging tools
EJB development tools
Team collaboration
Performance profiling tools
Server tools for testing and deployment
Plug-in project
Plug-in development tools
Fragment project
Plug-in component
Application Developer XML Tools
Window-Open Perspective-XML
XML perspective
XML editor
XML perspective editors
Creating an XML file from scratch
Select the option Create XML file from scratch
XML editor
Editing an XML file
Creating a DTD from scratch
DTD editor
Validating the XML file
DTD Editor
Using the Outline view to add DTD components
Validating DTD
Creating a schema from scratch
XSD editor
XML Schema Editor
Using the Outline view to add schema components
Making changes and referential integrity
Pop-up on schema file in the Outline view
Namespace
Validating schema
Creating an XSL file from scratch
XSL editor
Validating the XSL file
Namespace support
Editing an XSL file
Indicate all local elements to be qualified
XPath Builder
XPath support
10 XPath definition
11 XPath Operators
12 XPath functions
13 XPath Query Result screen
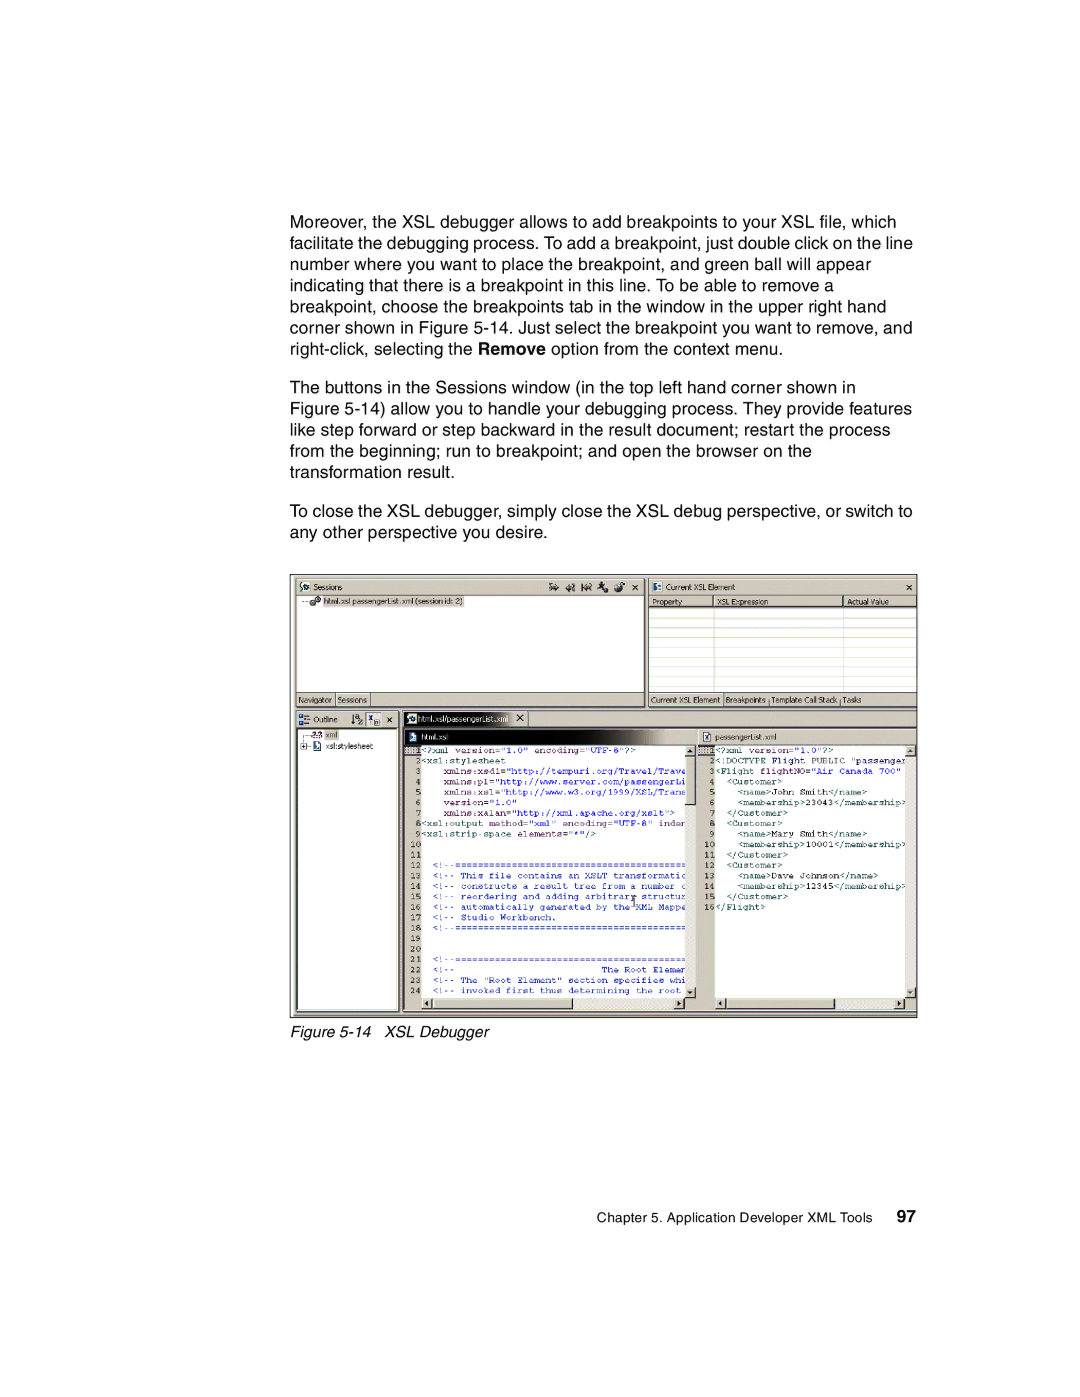
XSL debugger
14 XSL Debugger
Web service wizard
Web services support
Web Service Dadx group configuration wizard
Application Developer XML Tools
Page
101
RDB and XML integration
Passenger List Select statement
SQL to XML wizards
SQL to XML wizard panel
Example 6-1 XSL file for Show table columns as ‘Elements’
Show table column as option
XML and XSL files
Html
XML file generated with the Elements option
Html file
Html with the ‘Recurse through foreign keys’ unchecked
Html generated for Foreign key as links option
Aircraft Html generated for ‘Foreign key as links’ option
XML Schema file
RDB and XML integration
076/schema
Sequence
Example 6-4 XML Schema for Aircraft table
DTD file
Page
Flight Cdata #REQUIRED
Query template file
Statement Options
Example 6-9 Customer.xml
XML to SQL wizard
XML to SQL wizard Selecting the connection
10 XML to SQL wizard Selecting Schema and Action
11 XML to SQL wizard Selecting the column
DDL to XML Schema wizard
Example 6-10 XML Generated through the DDL to XML Schema
12 Generate XML Schema
Restriction base=string length value=30 SimpleType Element
Example 6-11 XML Schema for a single table using a Select
DB2 XML Extender
13 shows an overview of the XML Extender
XML Extender
UDTs created
Administrative support tables, UDTs, and UDFs
Administrative support tables created
UDFs created
Stored Procedures created
DTD Repository
Example 6-12 DTD representation of a book
Document Access Definitions DAD
Page
XML Column method
When to use XML Column method
XML Collection
Elements/attributes
As is xml document
15 XML Collection Method overview
When to use XML Collection method
Example 6-14 Sample DTD
Mapping schemes for XML collections
SQL mapping
Column name Data type
Employee table in Sample database
Empact Table in Sample database
Example 6-16 The RDBnode
RDBnode for the top elementnode
Example 6-17 RDBnode mapping
XML Extender administration tools
RDBnode for each attribute and textnode
XML MQSeries enablement
RDB and XML integration
Page
145
Click Finish
Select passengerList.dtd Right-clickGenerate-XML Schema
DTD XSD
Create an XML file from a DTD file
XML DTD/XSD
Create an XML file from an XSD file
Select Select file from Workspace option
Create DTD/XSD files from XML
Select passengerList.xsd Right-clickGenerate-XML File
Example 7-1 Customer.xml
Example 7-2 Customer DTD
Select Customer.xml Right-clickGenerate-XML Schema
Select customer.xml Right-clickGenerate-DTD
Example 7-3 Customer.xsd
Generate a Html from an XSD
Select passengerList.xsd file Right-clickGenerate-HTML Doc
Select J2EE Web Application Project. Click Next
JavaBeans from DTD/XSD
Click File-New-Project
Select passengerList.xsd Right-clickGenerate-JavaBeans
Generate XML/XSL from JavaBeans
Select Generate sample test program. Click Finish
Example 7-4 passenger.java
Page
Input XML Form screen
Click File-New-Java Bean XML Client
Click File-New-Other
Generate XML/XSL from Html
Adding annotation tags
Preparing the Html file for generation
Example 7-5 cus-template.xhtml
Example 7-6 Customer.xml
Select cus-template.xhtml Right-clickGenerate-XSL File
Select Customer.xhtml. Click Next
Page
161
Part 3 XML application development
Page
163
WebSphere and XML approaches
XML in Application development
Web services
Passenger List application
Solution Outline
Servlet
Web Services
XML in this application
Client Web Tier
Development and running of the Passenger List application
Technical implementation overview
Page
Discussion
Advantages of using the database
Enterprise JavaBeans
Interprise Application Server
Customer Registration application
Technical overview
Page
177
Developing XML Web services
Servlet
Creating the Web tier
Name Type
Create the Airline simple project
Create the Travel Web project
Design the XML Schema
Select File-New-XML Schema
PassengerList DOM Tree
Select root node
Creating XML Schema
XML Schema Example 9-1 PassengerList.xsd
Design an output
Generate XML file
Html and mapping approach
Example 9-2 Static XML file
Example 9-4 html.xml source
Select required and optional content, click Finish
Example 9-3 html.dtd
XML to Html mapping
Generate an XSL file
Source Target
Mapping XML to Html
Generating XSL from Xhtml
Create an XSL from scratch
Developing the servlet
Testing the XSL
Example 9-5 GetPassengerList Server doGet method
Javax.xml.transform.Source
Compiling XSL
Test the passenger list application
Javax.xml.transform.TranfrormerFactory
Javax.xml.transform.Transformer
11 XML Web service
Creating a Web service
Click Window-Open Perspective-Data
Create the database tier
Right-clickNew Connection
Right-clickImport to folder
PassengerList.xsd-Generate-DTD Figure
Generate DTD file
13 Generated DTD File
Loading DTD into XML Extender
Select RDB Table to XML Mapping, click Next
Creating DAD file using RDB to XML mapping
Membership
15 Edit Join Conditions
Click Mapping-Edit Join Conditions
16 RDB to XML mapping
Select passengerList.rmx
DAD Extension
Create the Web Service from Dadx file
Dadx Group
Web services and DB2 XML Extender
Group.properties File
Next
Generating the Dadx
18 Dadx Generation
Dadx operations
RetrieveXML
StoreXML
Deploying the Web service
Example 9-6 Updated Dadx file
Example 9-7 namspacetable mapping entry
19 Web Service settings
20 Testing Web Service
Test the Web Service
Mapping DTDIDs to XSD namespaces and locations
Modify passenger list application to use the Web Service
Example 9-8 Namespaces
Modifying the XSL file
Example 9-9 Changing root element
Example 9-10 passengerList.xsl
Page
Center
Creating Html input form
22 Input form GetPassengerList.html
Using Java proxy
23 passengerList result
Conclusion
Page
215
Development of XML-based Enterprise applications
XML based Enterprise application architecture
Multi-tier solution architecture
Customer registration
Solution outline for customer registration sample
Customer registration scenario outline
Retrieving customer information
Retrieving customer data scenario outline
Developing the customer registration sample
JavaBean to XML client wizard
Preparing to create the Web tier
Creating the Web tier
Customer JavaBean class specification
JavaBean XML/XSL client wizard
JavaBean XML/XSL client JavaBean selection
JavaBean XML/XSL client methods and properties selection
JavaBean XML/XSL client input form design
10 JavaBean XML/XSL client results form design
Investigating the Web-tier generated files
11 JavaBean XML/XSL client prefix specification
Page
Org.w3c.dom.Document
ProduceDOM Document
Java Bean
XML Data
Example 10-2 Source code for CustomerXSLServlet init method
Development of XML-based Enterprise applications
Xslt Processor Stylesheet Transformer
ProduceDOMDocument
XML Document
Example 10-4 Source code for the servlet doPost method
Form action=/Registration/CustomerXSLServlet method=post
Membership
Example 10-10 Sample of CustomerResult stylesheet form
Validating the Web tier
Example 10-12 Schema file for the XML data
15 Customer registration form
Building the entity EJB and the database schema
EJB mapping approaches review
Project configuration
Preparing to create the entity EJB
Creating the entity EJB
17 Create an Enterprise Bean wizard
18 Enterprise bean details
Creating the database mapping and tables
19 EJB to RBD Mapping wizard for CustomerInfo module
20 Target database specification
21 EJB to RDB mapping editor
22 Database connection definition
Access beans
Creating an access bean for the entity bean
Creating a Jdbc data source
23 Access Bean creation wizard
24 Data source definition for a server configuration
25 Jdbc data source definition
Binding the EJB to a Jdbc data source
Modifying CustomerXML
Integrating the entity EJB with the Web tier
Example 10-13 create source code
27 CustomerInfoWeb project properties
Example 10-14 CustomerXSLServlet doPost source code
Modifying CustomerXSLServlet
Retrieval function
Application deployment and testing
Example 10-15 Retrieval function
Example 10-16 Confirming the creation
28 Generating the deployed code for the EJB
Testing the registration application
29 Customer Registration form
Page
257
Light weight XML-based Enterprise Application
SQL to/from XML libraries
SQL-XML solution architecture
Customer registration
Light weight XML-based Enterprise Application
Retrieving customer information
XSL Servlet
XML Document format
Adding the libraries to the project
Converting an XML Document
XMLToSQL architecture
XMLToSQL
Modifying CustomerXSLServlet
Initializing the XMLToSQL class
Example 11-1 initSQLProperties method
Creating an XML Document
Modifying the produceDOMDocument method
Example 11-2 ProduceDOMDocumentforTools
We need to change to
Example 11-3 CustomerXSLServlet doRegister method
Executing the XMLToSQL class
Example 11-5 The xslif tag
Modifying the doPost method
Example 11-4 CustomerXSLServlet doPost method
Example 11-6 Customer.XSL firstname template
Adding the error case
JdbcDriver
Retrieving a customer
Statement
Format
Example 11-7 initQueryProperties method
Initializing the SQLToXML class
SQLToXML
Example 11-8 CustomerXSLServlet doQuery method
Executing the SQLToXML class
Example 11-10 showPage method
Modifying the showPage method
Example 11-9 CustomerXSLServlet doPost method for query
Example 11-12 Customer.XSL membership template
Modifying the doGet method
Example 11-11 showPage method
Example 11-13 Result XSL
Page
Customer Registration form
Using datasource with SQLToXML and XMLToSQL class
Getting the datasource
Class definition
Example 11-15 setDatasourceMethods
Constructors
Example 11-14 setDatasourceMethods
Execute methods
11 Core data is an XML
Conclusion
Page
283
Deploying your Web application
Exporting your project from Application Developer
Manual deployment
Starting the WebSphere AEs Admin Console
Installing the EAR file on WebSphere AEs
Select Enterprise Applications
Installing the EAR
Testing the application
Creating a remote server instance
Publishing to a remote server AEs
Creating a remote server instance
WebSphere Studio Application Developer Programming Guide
Remote server instance settings
Remote file transfer option
Remote copy options
WebSphere Studio Application Developer Programming Guide
Publishing to remote server
WebSphere Studio Application Developer Programming Guide
297
Part 4 Appendixes
Page
299
Installing Application Developer
Things to do before installation
WebSphere Studio Application Developer installation
Select options
Selecting your workspace
Programs-IBM WebSphere Studio Application Developer-IBM
Verifying the installation
WebSphere Studio Application Developer Programming Guide
305
Create groups and users
Hardware and software prerequisites
Stop the Web server processes
Install WebSphere Application Server
Check that IP ports are unused
10 Installation options
11 Security options
12 Snoop servlet accessed through embedded Web server
311
Using the Web material
Locating the Web material
System requirements for downloading the Web material
How to use the Web material
313
Abbreviations and acronyms
OTS
Referenced Web sites
IBM Redbooks
Other resources
315
IBM Redbooks collections
How to get IBM Redbooks
317
Index
Jaxp
Wsaa Xacml
Xsltc 48
Spine 475-0.875 250 459 pages
Page
Page
XML Files