Chapter 5 | Advanced Configuration |
The Add to List button adds the configured RMON event to the Event Table at the bottom of the screen.
The Event Table area contains the following additional field:
Statistics > Events Log
Time Displays the time that the event occurred.
Statistics > Port Utilization
Statistics > Port Utilization
The Port Utilization screen displays the amount of resources each interface is currently consuming. Ports in green are functioning normally, while ports in red are currently transmitting an excessive amount of network traffic.
Refresh Rate Indicates the amount of time that passes before the port utilization statistics are refreshed. The possible field values are:
•• No Refresh Indicates that the statistics are not refreshed.
•• 15 Sec Indicates that the statistics are refreshed every 15 seconds.
•• 30 Sec Indicates that the statistics are refreshed every 30 seconds.
•• 60 Sec Indicates that the statistics are refreshed every 60 seconds.
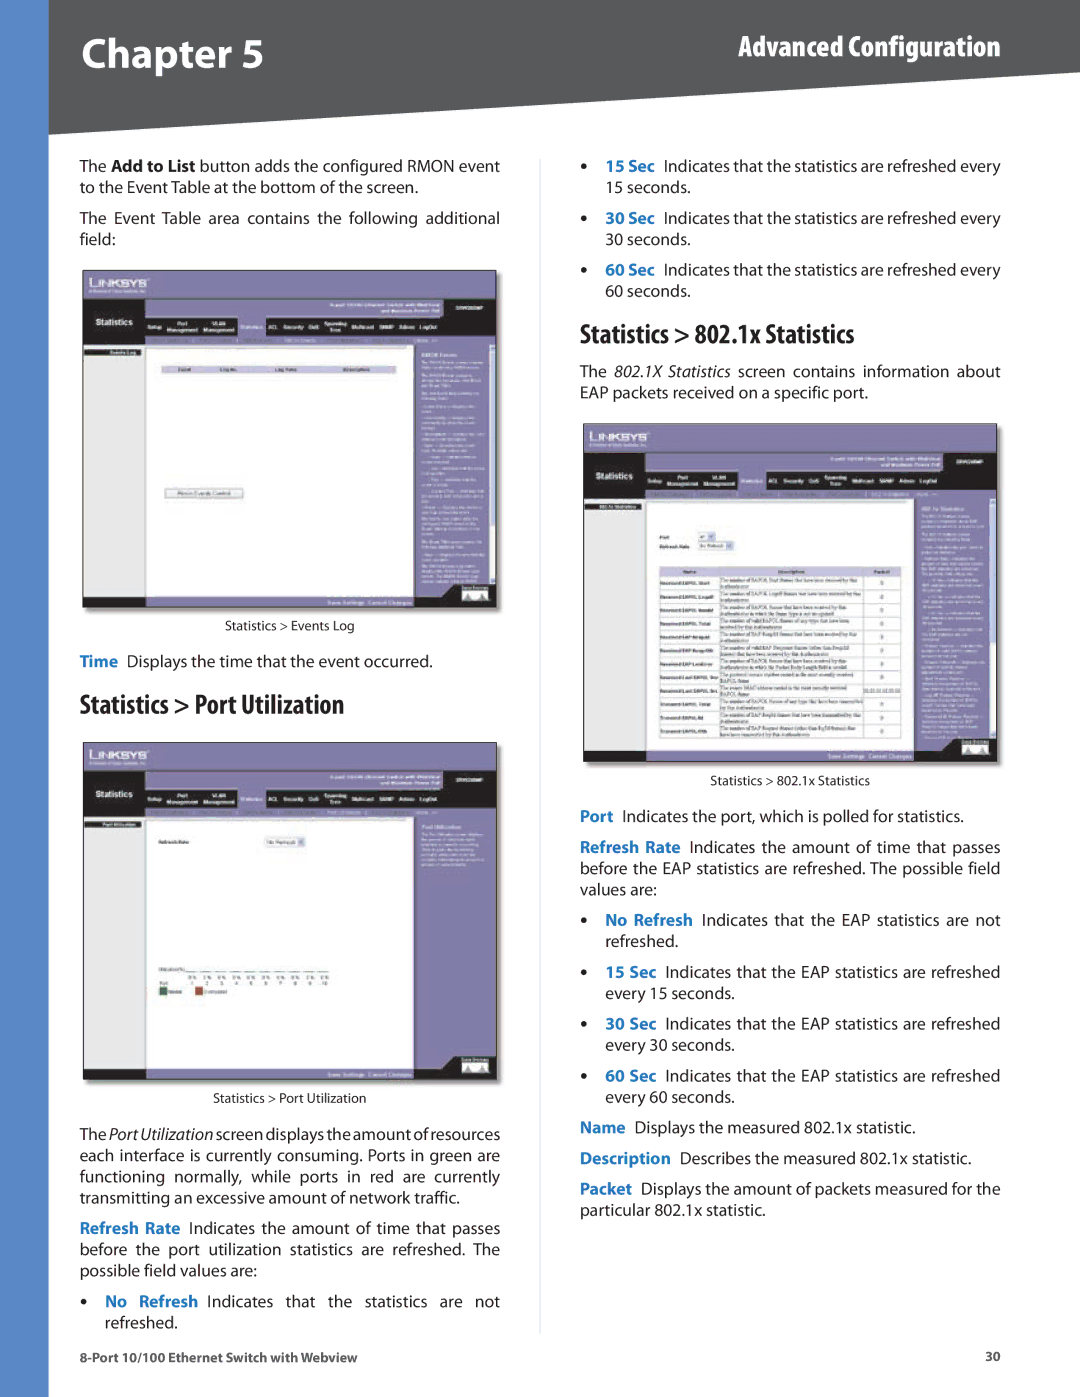
Statistics > 802.1x Statistics
The 802.1X Statistics screen contains information about EAP packets received on a specific port.
Statistics > 802.1x Statistics
Port Indicates the port, which is polled for statistics.
Refresh Rate Indicates the amount of time that passes before the EAP statistics are refreshed. The possible field values are:
•• No Refresh Indicates that the EAP statistics are not refreshed.
•• 15 Sec Indicates that the EAP statistics are refreshed every 15 seconds.
•• 30 Sec Indicates that the EAP statistics are refreshed every 30 seconds.
•• 60 Sec Indicates that the EAP statistics are refreshed every 60 seconds.
Name Displays the measured 802.1x statistic. Description Describes the measured 802.1x statistic.
Packet Displays the amount of packets measured for the particular 802.1x statistic.
30 |
