EDS-405A, EDS-408A specifications
Moxa Technologies has established itself as a leader in networking solutions, particularly for industrial applications. Among their cutting-edge products is the 405A Series, specifically the EDS-408A model, which exemplifies Moxa's commitment to performance, reliability, and versatility in industrial Ethernet switches.The EDS-408A is an 8-port industrial Ethernet switch that offers an impressive array of features and capabilities designed to meet the demands of harsh environments. One of its main highlights is the ability to support both 10/100 Mbps Fast Ethernet and Gigabit Ethernet connections, providing users with the flexibility to integrate a range of devices within their network. Its robust design ensures that it operates seamlessly in extreme conditions, with a wide operating temperature range from -40 to 75 degrees Celsius.
The EDS-408A is built to support an array of networking topologies. It features advanced Ethernet switching technologies that enable fast and efficient data transfer while minimizing latency. The device is equipped with wire-speed forwarding capabilities, which is vital for maintaining high performance in heavy network traffic scenarios.
Another key feature of the EDS-408A is its redundancy support. The switch incorporates various redundancy protocols, including Rapid Spanning Tree Protocol (RSTP) and MRP (Media Redundancy Protocol), which enhance network reliability by allowing quick recovery in the event of a failure. This ensures continuous network uptime, which is critical for industrial applications.
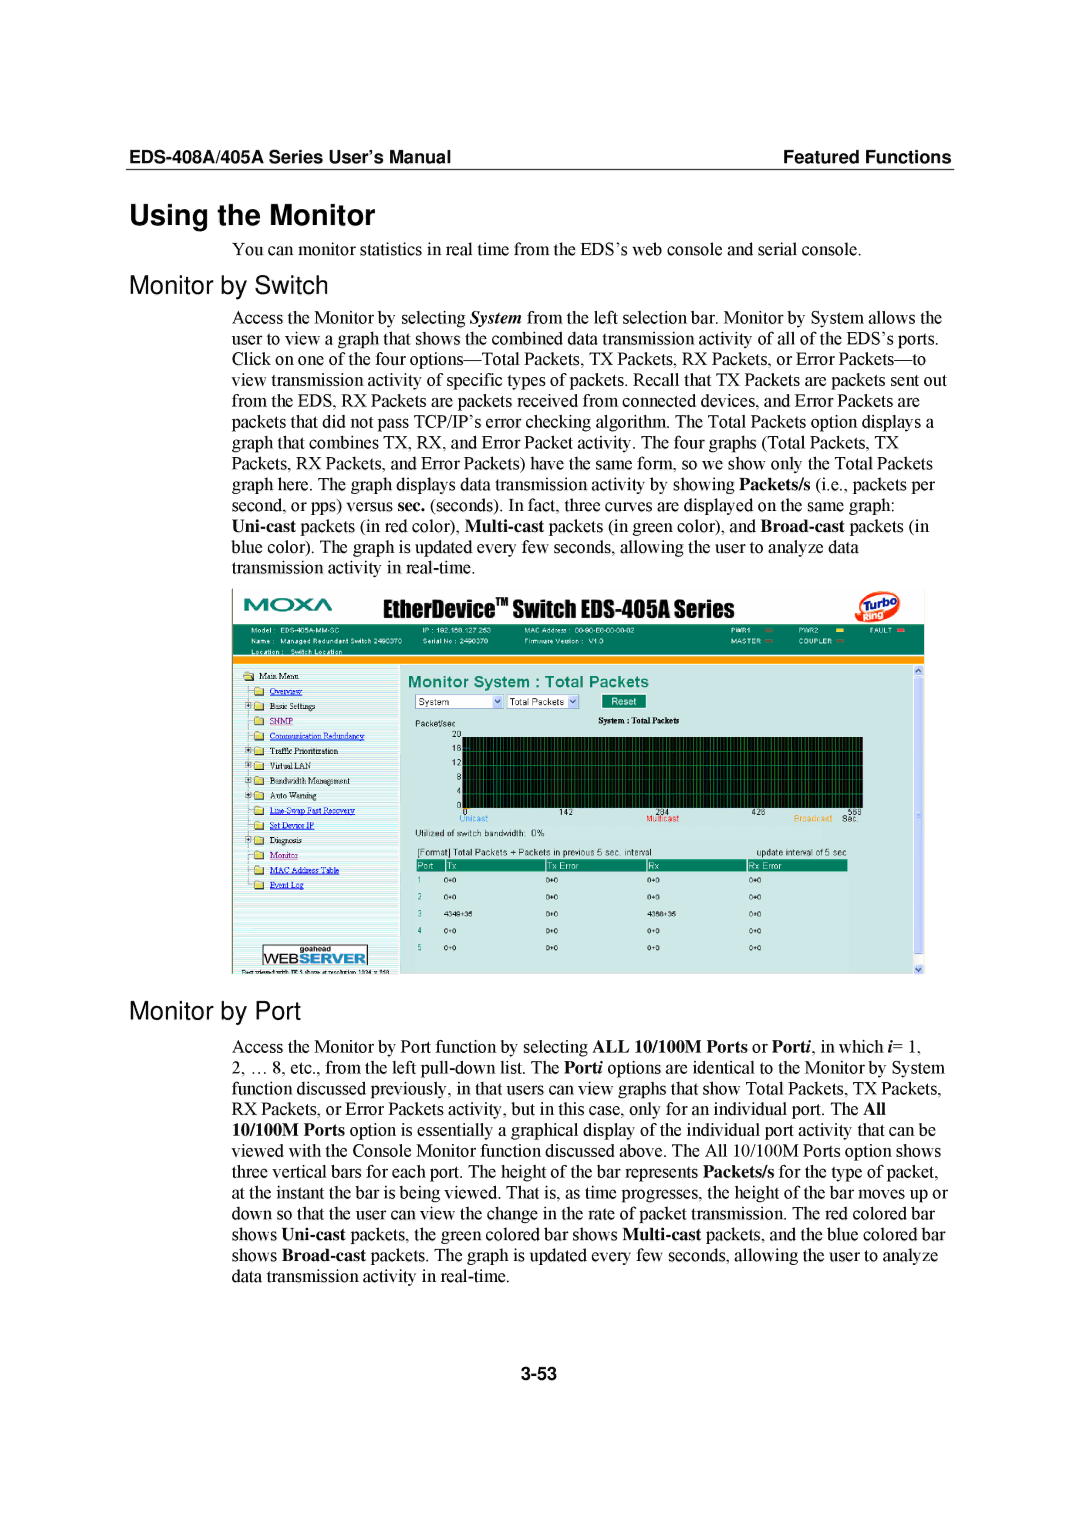
Furthermore, Moxa Technologies has adopted an user-friendly web-based management interface in the EDS-408A, simplifying the configuration and monitoring process. This allows system administrators to easily manage settings, monitor traffic, and troubleshoot issues in real time. Additionally, the switch supports SNMP (Simple Network Management Protocol) for remote monitoring and management, enabling organizations to keep their networks optimized.
Security is another paramount feature of the EDS-408A. It includes built-in security mechanisms such as port security, VLAN, and access control lists (ACLs), which help safeguard sensitive network segments from unauthorized access.
In conclusion, Moxa Technologies' EDS-408A model from the 405A Series is a robust and feature-rich industrial Ethernet switch designed for demanding environments. With its support for various network protocols, redundancy features, user-friendly management, and enhanced security, the EDS-408A stands out as a reliable solution for organizations looking to enhance their industrial networking capabilities.

