Frequency and cone width
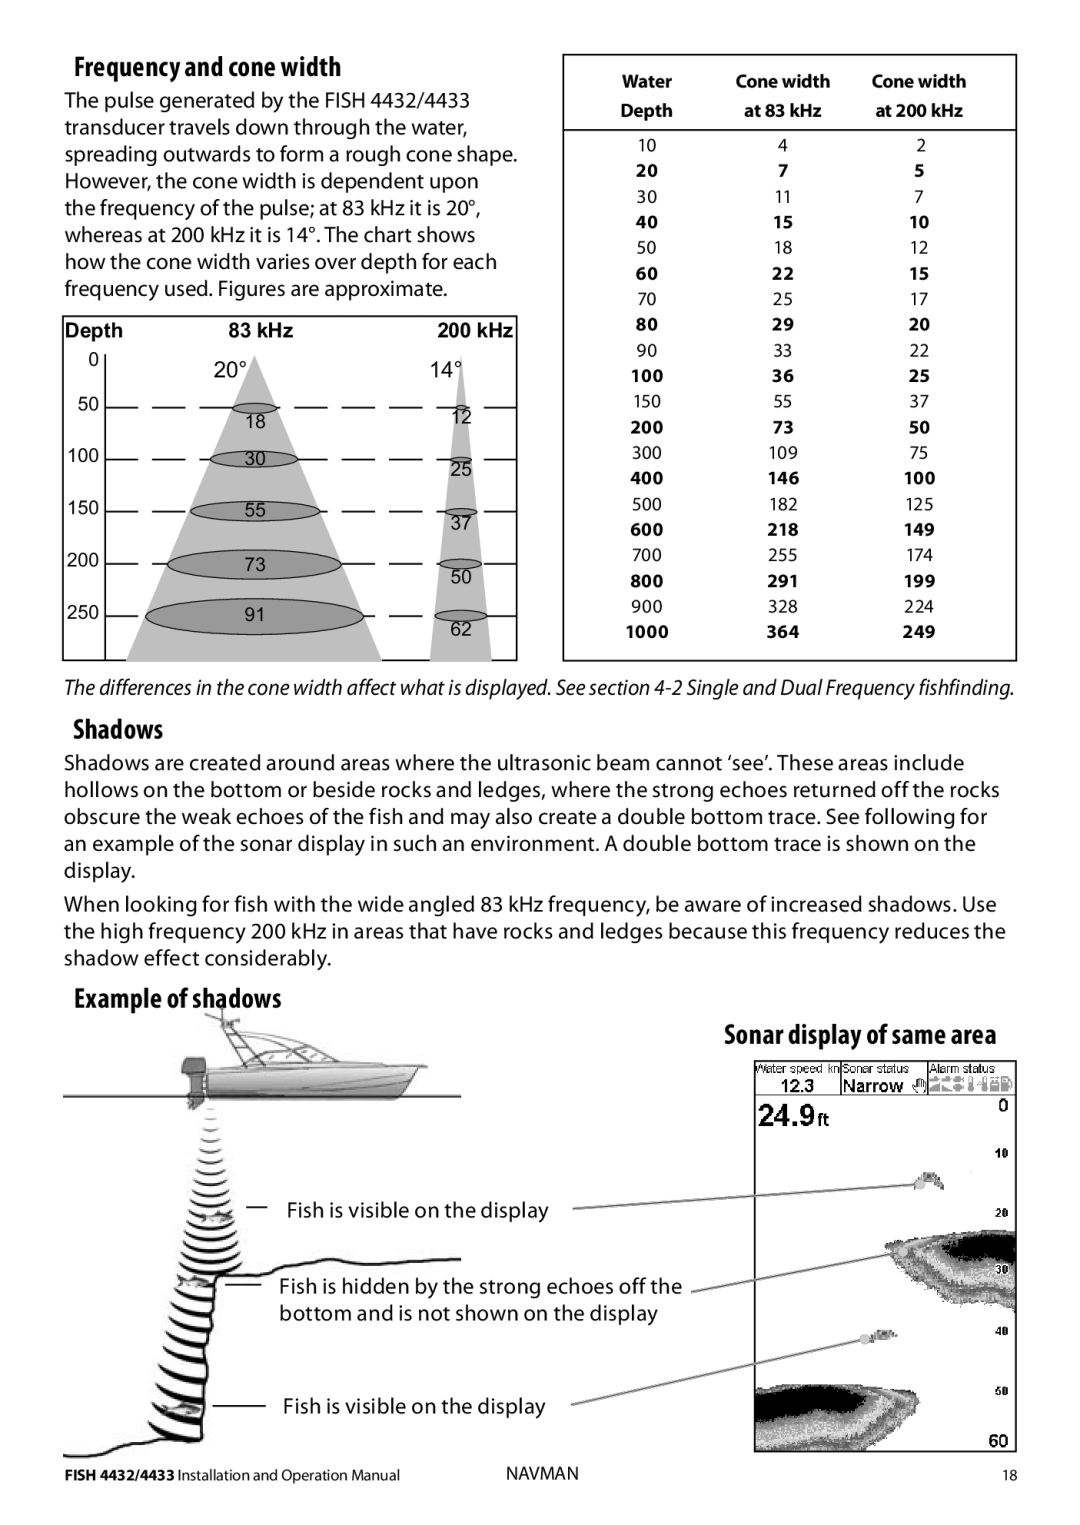
The pulse generated by the FISH 4432/4433 transducer travels down through the water, spreading outwards to form a rough cone shape. However, the cone width is dependent upon the frequency of the pulse; at 83 kHz it is 20°, whereas at 200 kHz it is 14°. The chart shows how the cone width varies over depth for each frequency used. Figures are approximate.
Depth | 83 kHz | 200 kHz |
0 | 20° | 14° |
| ||
50 | 18 | 12 |
| ||
100 | 30 | 25 |
|
| |
150 | 55 | 37 |
|
| |
200 | 73 | 50 |
|
| |
250 | 91 | 62 |
|
|
Water | Cone width | Cone width |
Depth | at 83 kHz | at 200 kHz |
|
|
|
10 | 4 | 2 |
20 | 7 | 5 |
30 | 11 | 7 |
40 | 15 | 10 |
50 | 18 | 12 |
60 | 22 | 15 |
70 | 25 | 17 |
80 | 29 | 20 |
90 | 33 | 22 |
100 | 36 | 25 |
150 | 55 | 37 |
200 | 73 | 50 |
300 | 109 | 75 |
400 | 146 | 100 |
500 | 182 | 125 |
600 | 218 | 149 |
700 | 255 | 174 |
800 | 291 | 199 |
900 | 328 | 224 |
1000 | 364 | 249 |
|
|
|
The differences in the cone width affect what is displayed. See section
Shadows
Shadows are created around areas where the ultrasonic beam cannot ‘see’. These areas include hollows on the bottom or beside rocks and ledges, where the strong echoes returned off the rocks obscure the weak echoes of the fish and may also create a double bottom trace. See following for an example of the sonar display in such an environment. A double bottom trace is shown on the display.
When looking for fish with the wide angled 83 kHz frequency, be aware of increased shadows. Use the high frequency 200 kHz in areas that have rocks and ledges because this frequency reduces the shadow effect considerably.
Example of shadows
Sonar display of same area
Fish is visible on the display
Fish is hidden by the strong echoes off the ![]() bottom and is not shown on the display
bottom and is not shown on the display
Fish is visible on the display
FISH 4432/4433 Installation and Operation Manual | NAVMAN | 18 |