5 Signal Management
|
|
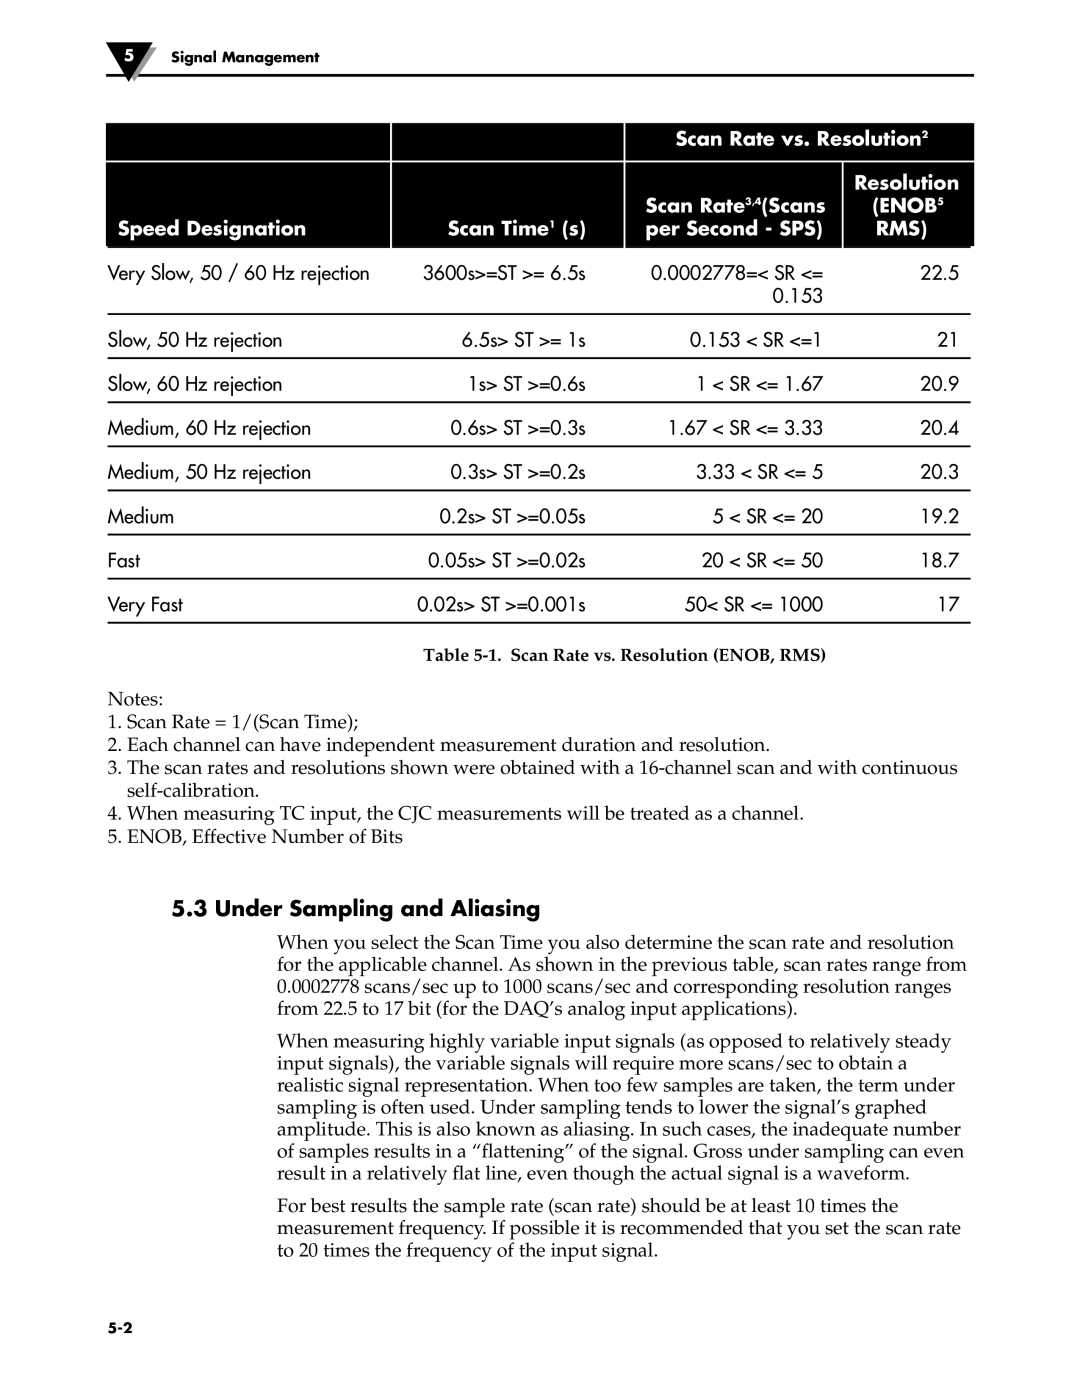
| Scan Rate vs. Resolution2 | ||
|
|
|
| Resolution | |
|
|
| Scan Rate3,4(Scans | (ENOB5 | |
| Speed Designation | Scan Time1 (s) | per Second - SPS) | RMS) | |
| Very Slow, 50 / 60 Hz rejection | 3600s>=ST >= 6.5s | 0.0002778=< SR <= | 22.5 |
|
|
|
| 0.153 |
|
|
|
|
|
|
|
|
| Slow, 50 Hz rejection | 6.5s> ST >= 1s | 0.153 < SR <=1 | 21 |
|
|
|
|
|
|
|
| Slow, 60 Hz rejection | 1s> ST >=0.6s | 1 < SR <= 1.67 | 20.9 |
|
|
|
|
|
|
|
| Medium, 60 Hz rejection | 0.6s> ST >=0.3s | 1.67 < SR <= 3.33 | 20.4 |
|
|
|
|
|
|
|
| Medium, 50 Hz rejection | 0.3s> ST >=0.2s | 3.33 < SR <= 5 | 20.3 |
|
|
|
|
|
|
|
| Medium | 0.2s> ST >=0.05s | 5 < SR <= 20 | 19.2 |
|
|
|
|
|
|
|
| Fast | 0.05s> ST >=0.02s | 20 < SR <= 50 | 18.7 |
|
|
|
|
|
|
|
| Very Fast | 0.02s> ST >=0.001s | 50< SR <= 1000 | 17 |
|
|
|
|
|
|
|
Table
Notes:
1.Scan Rate = 1/(Scan Time);
2.Each channel can have independent measurement duration and resolution.
3.The scan rates and resolutions shown were obtained with a
4.When measuring TC input, the CJC measurements will be treated as a channel.
5.ENOB, Effective Number of Bits
5.3 Under Sampling and Aliasing
When you select the Scan Time you also determine the scan rate and resolution for the applicable channel. As shown in the previous table, scan rates range from 0.0002778 scans/sec up to 1000 scans/sec and corresponding resolution ranges from 22.5 to 17 bit (for the DAQ’s analog input applications).
When measuring highly variable input signals (as opposed to relatively steady input signals), the variable signals will require more scans/sec to obtain a realistic signal representation. When too few samples are taken, the term under sampling is often used. Under sampling tends to lower the signal’s graphed amplitude. This is also known as aliasing. In such cases, the inadequate number of samples results in a “flattening” of the signal. Gross under sampling can even result in a relatively flat line, even though the actual signal is a waveform.
For best results the sample rate (scan rate) should be at least 10 times the measurement frequency. If possible it is recommended that you set the scan rate to 20 times the frequency of the input signal.