Test Results
1.6 Test Results
Tables
Table
Line/Load | 0.3 A | 0.9 A | 1.5 A | 3.0 A | 5.0 A | Load Reg. | |
5.5 V | Vo(V) | 3.330 | 3.329 | 3.328 | 3.324 | 3.320 | 0.18% |
6.0 V | Vo(V) | 3.330 | 3.329 | 3.328 | 3.324 | 3.320 | 0.18% |
7.0 V | Vo(V) | 3.330 | 3.328 | 3.328 | 3.325 | 3.321 | 0.15% |
8.0 V | Vo(V) | 3.330 | 3.329 | 3.328 | 3.325 | 3.321 | 0.15% |
9.0 V | Vo(V) | 3.331 | 3.330 | 3.328 | 3.325 | 3.321 | 0.18% |
10 V | Vo(V) | 3.331 | 3.330 | 3.328 | 3.325 | 3.321 | 0.18% |
11 V | Vo(V) | 3.331 | 3.330 | 3.328 | 3.325 | 3.321 | 0.18% |
12 V | Vo(V) | 3.331 | 3.330 | 3.329 | 3.325 | 3.321 | 0.18% |
|
|
|
|
|
|
| |
Line Reg. | 0.03% | 0.06% | 0.03% | 0.03% | 0.03% |
| |
Note: The calculation for load regulation only accounts for the worst case of load variation under the normal voltage condition (i.e., 3.3 V at 3 A). All voltages were measured at the PCB header pins.
Table 1–3. Load Regulation and Ripple, 3.3-V (9-V Input)
Load | No Load | 0.50 A | 1.0 A | 2.0 A | 3.0 A | 5.0 A | Reg. |
Vo(V) | 3.331 | 3.330 | 3.329 | 3.327 | 3.325 | 3.321 | 0.18% |
Vo Ripple (mV | 16 | 16 | 18 | 24 | 24 | 32 |
|
Vo Spikes (mV | 0 | 24 | 24 | 34 | 48 | 60 |
|
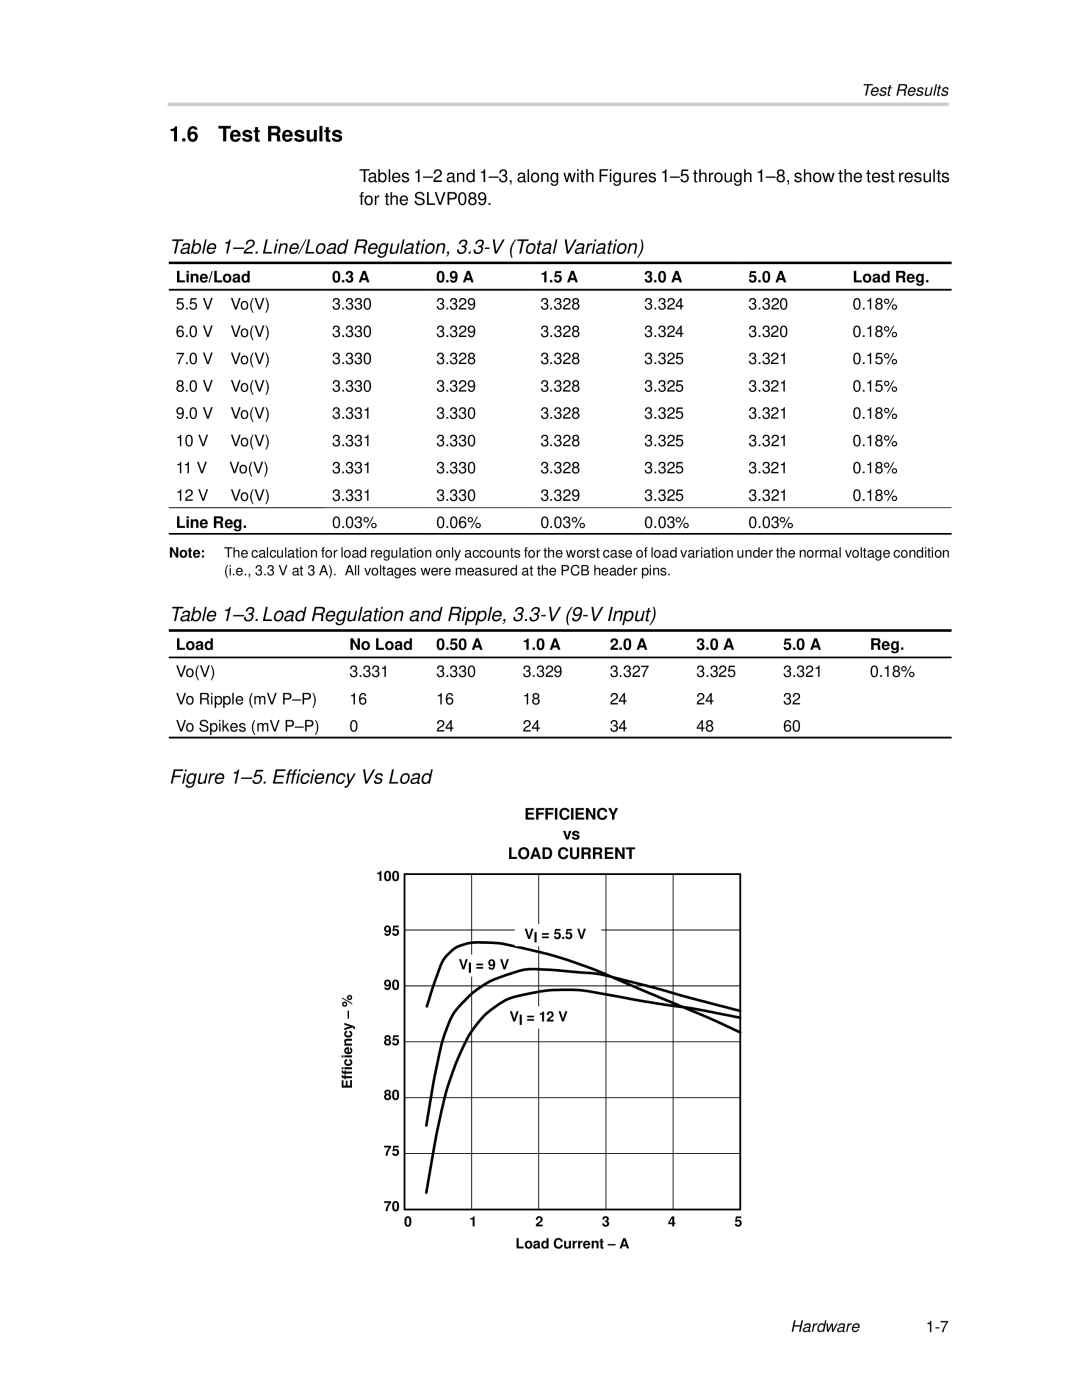
Figure 1–5. Efficiency Vs Load
EFFICIENCY
vs
LOAD CURRENT
| 100 |
|
|
|
|
|
| 95 |
| VI = 5.5 V |
|
|
|
|
| VI = 9 V |
|
|
|
|
– % | 90 |
|
|
|
|
|
|
| VI = 12 V |
|
|
| |
Efficiency |
|
|
|
|
| |
85 |
|
|
|
|
| |
80 |
|
|
|
|
| |
|
|
|
|
|
| |
| 75 |
|
|
|
|
|
| 70 |
|
|
| 4 | 5 |
| 0 | 1 | 2 | 3 | ||
|
|
| Load Current – A |
|
| |
Hardware1-7