Design Procedures
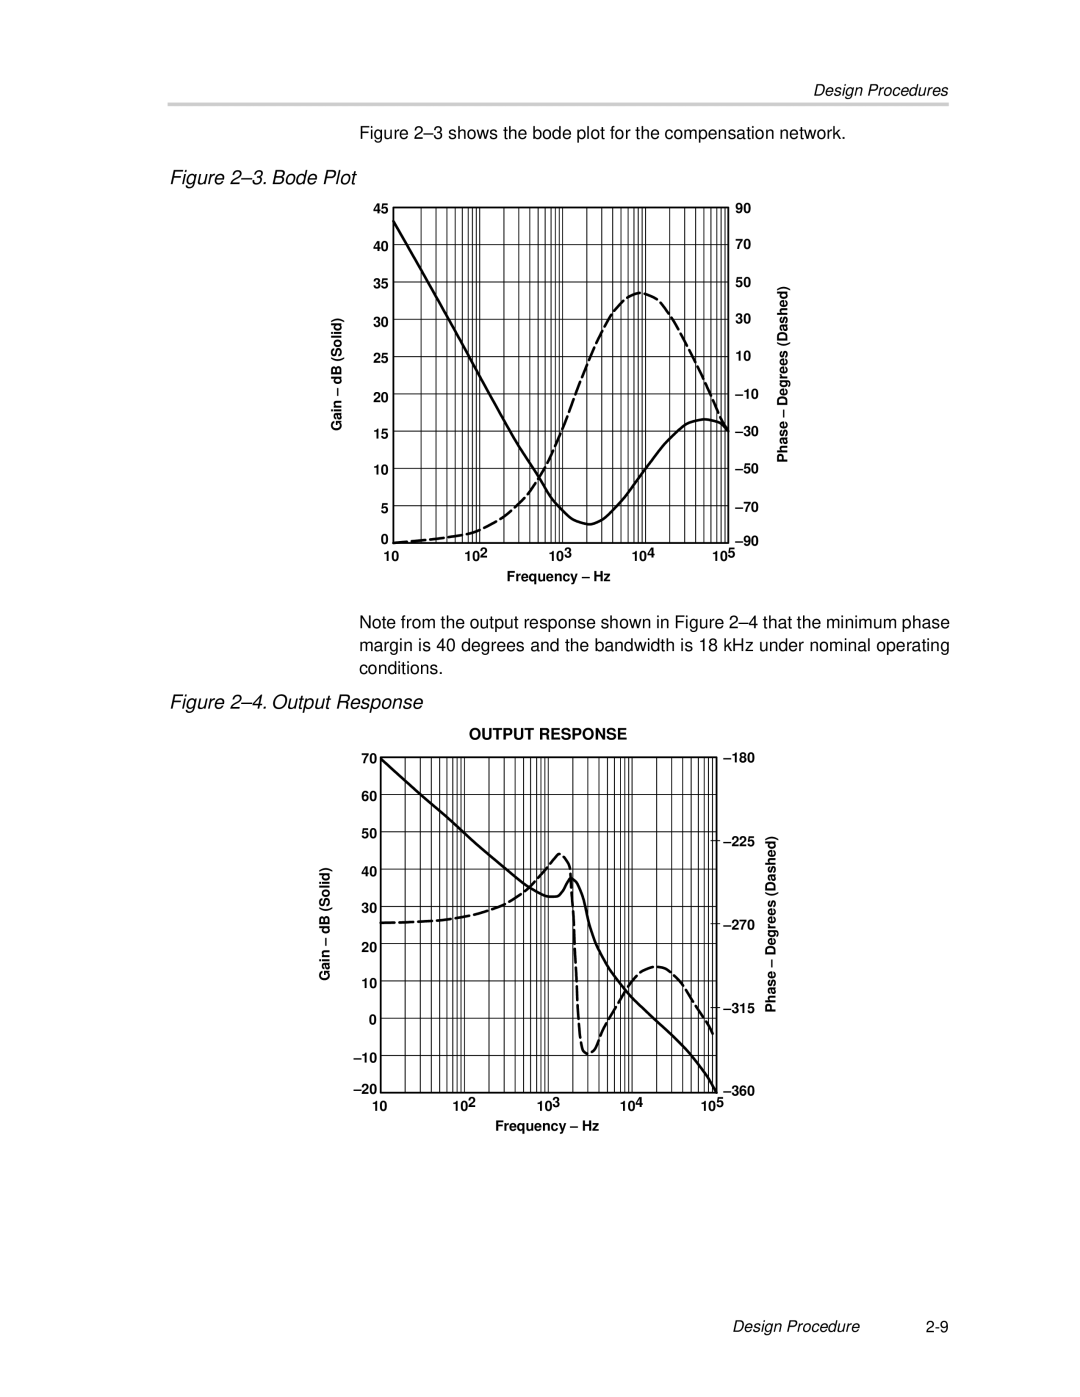
Figure 2–3 shows the bode plot for the compensation network.
Figure 2–3. Bode Plot
| 45 |
|
|
| 90 |
|
| 40 |
|
|
| 70 |
|
| 35 |
|
|
| 50 | Phase – Degrees (Dashed) |
Gain – dB (Solid) | 30 |
|
|
| 30 | |
25 |
|
|
| 10 | ||
20 |
|
|
| |||
15 |
|
|
| |||
10 |
|
|
| |||
|
|
|
|
| ||
| 5 |
|
|
|
| |
| 0 | 102 | 103 | 104 |
| |
| 10 | 105 |
|
Frequency – Hz
Note from the output response shown in Figure
Figure 2–4. Output Response
OUTPUT RESPONSE
| 70 |
|
|
|
| |
| 60 |
|
|
|
|
|
| 50 |
|
|
| Phase – Degrees (Dashed) | |
|
|
|
|
| ||
Gain – dB (Solid) | 40 |
|
|
|
| |
30 |
|
|
|
| ||
|
|
|
| |||
20 |
|
|
|
| ||
10 |
|
|
|
| ||
0 |
|
|
| |||
|
|
|
|
| ||
|
|
|
|
|
| |
|
|
|
|
|
| |
| 102 | 103 | 104 |
| ||
| 10 | 105 |
|
Frequency – Hz
Design Procedure |