Creating lists and statistical plots
To create categorical and number lists:
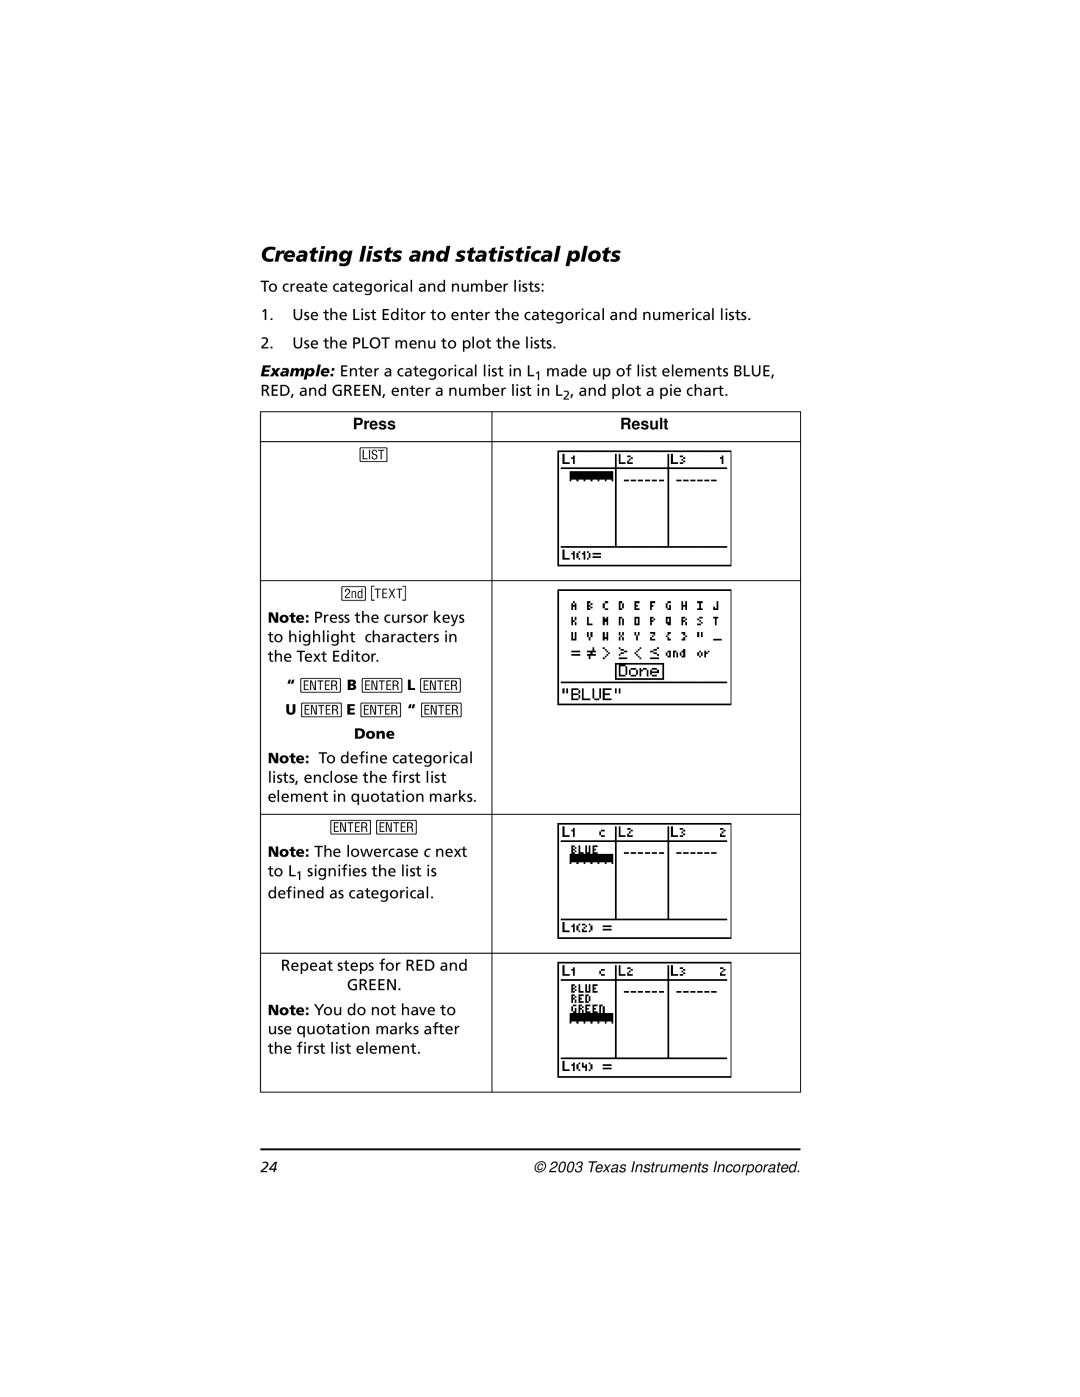
1.Use the List Editor to enter the categorical and numerical lists.
2.Use the PLOT menu to plot the lists.
Example: Enter a categorical list in L1 made up of list elements BLUE, RED, and GREEN, enter a number list in L2, and plot a pie chart.
Press | Result |
|
|
3 |
|
|
|
| |
Note: Press the cursor keys |
|
to highlight characters in |
|
the Text Editor. |
|
“ bB bL b |
|
U bE b“ b |
|
Done |
|
Note: To define categorical |
|
lists, enclose the first list |
|
element in quotation marks. |
|
|
|
bb |
|
Note: The lowercase c next |
|
to L1 signifies the list is |
|
defined as categorical. |
|
|
|
Repeat steps for RED and |
|
GREEN. |
|
Note: You do not have to |
|
use quotation marks after |
|
the first list element. |
|
|
|
24 | © 2003 Texas Instruments Incorporated. |