* Equalizers
The
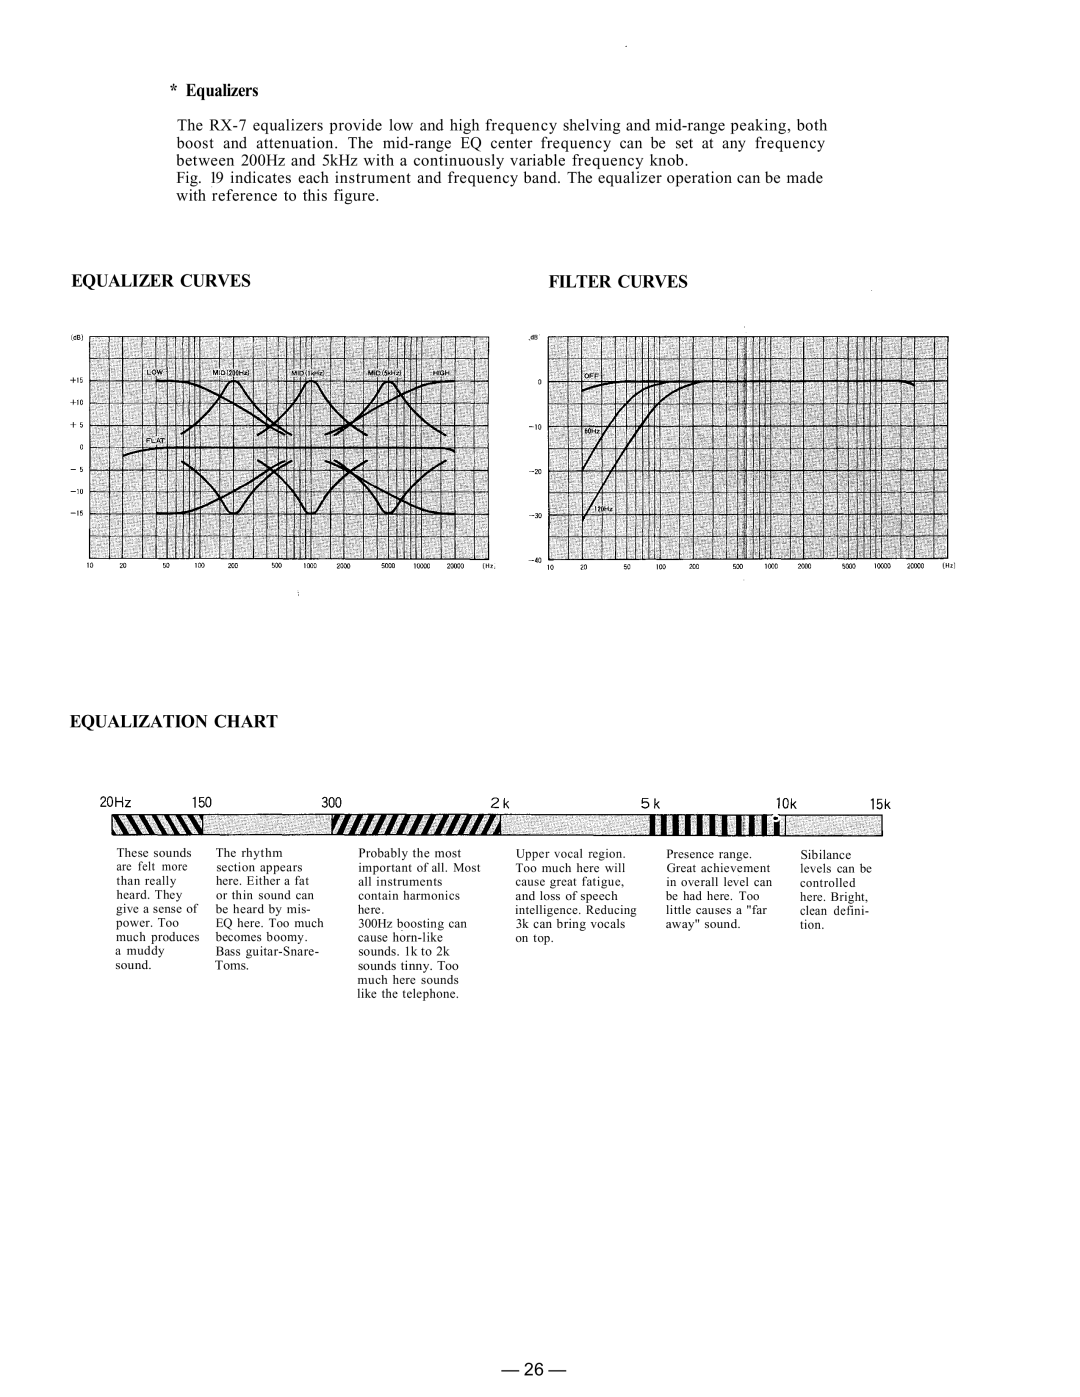
Fig. 19 indicates each instrument and frequency band. The equalizer operation can be made with reference to this figure.
EQUALIZER CURVES | FILTER CURVES |
EQUALIZATION CHART
These sounds | The rhythm | Probably the most | Upper vocal region. | Presence range. |
are felt more | section appears | important of all. Most | Too much here will | Great achievement |
than really | here. Either a fat | all instruments | cause great fatigue, | in overall level can |
heard. They | or thin sound can | contain harmonics | and loss of speech | be had here. Too |
give a sense of | be heard by mis- | here. | intelligence. Reducing | little causes a "far |
power. Too | EQ here. Too much | 300Hz boosting can | 3k can bring vocals | away" sound. |
much produces | becomes boomy. | cause | on top. |
|
a muddy | Bass | sounds. 1k to 2k |
|
|
sound. | Toms. | sounds tinny. Too |
|
|
|
| much here sounds |
|
|
|
| like the telephone. |
|
|
Sibilance levels can be controlled here. Bright, clean defini- tion.
— 26 —