Rev 1910010529
Copyright & Trademarks
Contents
Gvrp
TC Protect 101
11.4.1
11.4.2
Ntdp
VII
Package Contents
Conventions
About this Guide
Intended Readers
Overview of This Guide
Path
Switch, which facilitates you to monitor the Igmp messages
Return to Contents
Introduction
Overview of the Switch
Main Features
¾ LEDs Name Status Indication
Appearance Description
Front Panel
Rear Panel
Configuration
Login to the Switch
Login
Return to Contents
System Summary
System
System Info
¾ Port Status
Type
¾ Port Info
Port
Rate
¾ Device Description
Device Description
¾ Bandwidth Utilization
¾ Time Info
¾ Time Config
System Time
System IP
User Manage
User Table
User Config
¾ User Info
Confirm Password Retype the password
Config Restore
Password
User ID, Name, Access Level and status Operation
¾ Config Backup
Config Backup
Firmware Upgrade
System Reboot
System Reset
Access Security
Access Control
IP Address&Mask
¾ Access Control Config
¾ Session Config
MAC Address
SSL Config
¾ Access User Number
¾ Certificate Download
SSH Config
¾ Global Config
¾ Key Download
Max Connect
Idle Timeout
Protocol
Download
¾ Configuration Procedure
Key Type
¾ Network Requirements
Application Example 2 for SSH
Page
Return to Contents
Port
Switching
Port Config
Port Select
Speed and Duplex
Port Mirror
Description
Flow Control
Ingress
¾ Mirroring Port
¾ Mirrored Port
Egress
Port Security
¾ Port Security
Learned Num
Port Isolation
Max Learned MAC
¾ Port Isolation List
¾ Port Isolation Config
Forward Portlist Select the port that to be forwarded to
Forward Portlist Display the forwardlist
LAG
LAG Table
Group Number
Aggregate Arithmetic
¾ LAG Table
Member
¾ LAG Config
Static LAG
Lacp Config
LAG will delete this LAG
System Priority
¾ Lacp Config
Admin Key
Port Priority
¾ Auto Refresh
Traffic Monitor
Traffic Summary
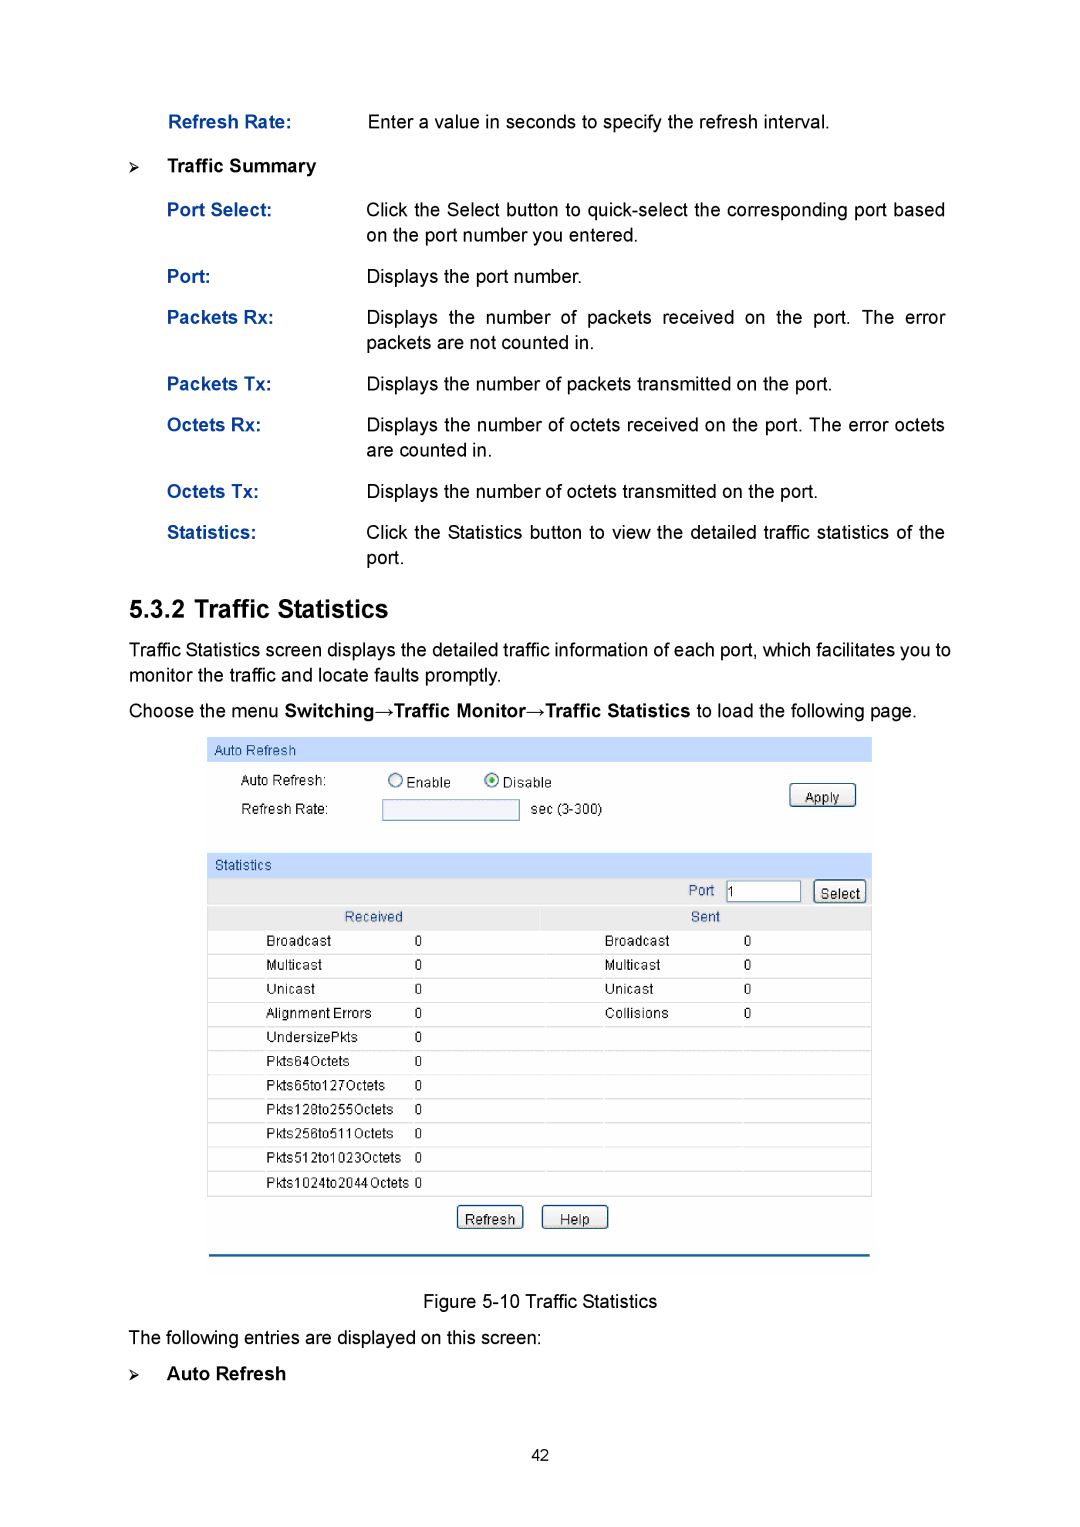
Traffic Statistics
MAC Address
Bound
Type Configuration Way Aging out
Relationship
Address and the port
¾ Search Option
¾ Address Table
Displays the corresponding Vlan ID of the MAC address
MAC Address Displays the MAC address learned by the switch
Static Address
¾ Create Static Address
Dynamic Address
¾ Static Address Table
¾ Aging Config
¾ Dynamic Address Table
Filtering Address
Bind
¾ Create Filtering Address
¾ Filtering Address Table
Vlan
Vlan implementation
802.1Q Vlan
¾ Link Types of ports
Vlan Config
¾ Pvid
Description :
¾ Vlan Table
Vlan ID Select
Members Operation :
Is valid or not
¾ Vlan Config
Enter the ID number of Vlan
¾ Vlan Members
¾ Vlan Port Config
Port Displays the port number
¾ Vlan of Port
Required. On the VLAN→802.1Q VLAN→Port Config page, set
Required. On the VLAN→802.1Q VLAN→VLAN Config
Vlan Description
Optional. On the VLAN→802.1Q VLAN→VLAN Config
MAC Vlan
MAC Select
Port Enable
¾ MAC Vlan Table
Required. On the VLAN→MAC VLAN→Port Enable
Protocol Vlan
¾ Create Protocol Vlan
Protocol Vlan
Protocol Template
¾ Protocol Vlan Table
¾ Create Protocol Template
¾ Protocol Template Table
Application Example for 802.1Q Vlan
Application Example for MAC Vlan
Required. On VLAN→802.1Q VLAN→Port Config page, configure
Required. On VLAN→802.1Q VLAN→VLAN Config page, create a
Operation Description
¾ Network Diagram ¾ Configuration Procedure
Application Example for Protocol Vlan
Required. On VLAN→Protocol VLAN→Protocol Template
On VLAN→Protocol VLAN→Protocol Vlan page, create protocol
Protocol type Value
¾ VPN Up-link Ports
VPN Config
Vlan Mapping
¾ Vlan Mapping Config
¾ Vlan Mapping Table
Required. On the VLAN→VLAN VPN→Port Enable
Required. On the VLAN→VLAN VPN→VPN Config
Optional. On the VLAN→VLAN VPN→VPN Config
Required. On the VLAN→VLAN VPN→VLAN Mapping
Gvrp
¾ Garp
¾ Gvrp
¾ Port Config
Select Port Status Registration Mode
Configuration Procedure
Private Vlan
¾ Private Vlan Implementation
¾ Features of Private Vlan
¾ The Elements of a Private Vlan
Pvid
¾ Packet forwarding in Private Vlan
Pvlan
Primary Vlan
¾ Create Private Vlan
¾ Private Vlan Table
Secondary Vlan
¾ Private Vlan Port Table
Port Select the desired port for configuration Port Type
Required. On the VLAN→Private VLAN→Port Configure
Required. On the VLAN→Private VLAN→PVLAN
Application Example for Private Vlan
Required. On the VLAN→802.1Q VLAN→VLAN Config page, click
Spanning Tree
¾ STP Elements
¾ STP Timers
¾ Bpdu Comparing Principle in STP mode
¾ STP Generation
Step Operation
¾ Mstp Elements
Tips:
¾ Rstp Elements
¾ Port States
¾ Port Roles
STP Config
STP Config
Hello Time
Forward Delay
Version
Max Age
STP Summary
Port Config
STP Summary
IntPath
Priority
ExtPath
Edge Port
Port Role
Region Config
Mstp Instance
Port Status
Instance Config
¾ Region Config
Instance
Instance Port Config
¾ Instance Table
Clear
Instance ID
Path Cost
STP Security
Port Protect
¾ Bpdu Filter
¾ TC Protect
¾ Bpdu Protect
TC Protect
Loop Protect
Root Protect
Bpdu Protect
TC Protect
11 TC Protect
Application Example for STP Function
On Spanning Tree→STP Config→STP Config
On Spanning Tree→STP Config→Port Config
On Spanning Tree→MSTP Instance→Instance
Bridge of Instance
Configure Switch D
¾ Suggestion for Configuration
¾ Multicast Address
Multicast
¾ Multicast Overview
¾ Multicast Address Table
Multicast IP Port
¾ Igmp Snooping Process
Igmp Snooping
¾ Igmp Snooping
¾ Igmp Messages
Snooping Config
¾ Igmp Snooping Fundamentals
¾ Igmp Snooping Status
Description Displays Igmp Snooping status Member
Igmp Snooping
Fast Leave
Leave Time
Router Port Time
Member Port Time
Static Router Port
Multicast Vlan
Snooping→Snooping Config and Port Config
Multicast→IGMP Snooping→VLAN Config
Router Port
¾ Multicast Vlan
Vlan
On the Multicast→IGMP Snooping→Snooping Config
Application Example for Multicast Vlan
Multicast→IGMP Snooping→Multicast Vlan
Snooping→Snooping Config
¾ Configuration Procedure Step Operation Description
Snooping→Port Config
Multicast IP
Multicast IP Table
Static Multicast IP
¾ Create Static Multicast
¾ Static Multicast IP Table
Multicast Filter
IP-Range
¾ Port Filter Config
Port Filter
Multicast→Multicast Filter→Port Filter
Packet Statistics
Multicast→Multicast Filter→IP-Range
¾ Igmp Statistics
¾ QoS
¾ Priority Mode
QoS
¾ Schedule Mode
802.1Q frame
SP-Mode
Port Priority
¾ Port Priority Config
DiffServ
Displays the LAG number which the port belongs to
Schedule Mode
¾ Schedule Mode Config
¾ Priority Level
¾ 802.1P Priority Config
3 802.1P Priority
Dscp Priority
Priority Level
¾ Dscp Priority Config
It ranges from 0 to
Priority levels are labeled as TC0, TC1, TC2 and TC3
Rate Limit
¾ Rate Limit Config
Bandwidth Control
Egress Ratebps
Storm Control
Ingress Rate bps
Bps
¾ Storm Control Config
Broadcast Rate
Multicast Rate
Number OUI Address Vendor
¾ Port Voice Vlan Mode
Voice Vlan
¾ Security Mode of Voice Vlan
Packet Type Processing Mode
Global Config
12 Global Configuration
Port Mode
13 Port Config
OUI Config
Required. On QoS→Voice VLAN→Port Config
Required. On VLAN→802.1Q VLAN→Port Config
Optional. On QoS→Voice VLAN→OUI Config page, you
Required. On QoS→Voice VLAN→Global Config
Time-Range Summary
ACL
Time-Range
Index
Time-Range Create
¾ Create Holiday
ACL Config
Holiday Config
¾ Holiday Table
¾ Rule Table
ACL Summary
ACL Create
¾ Create ACL
Rule ID
MAC ACL
¾ Create MAC ACL
EtherType
Fragment
Standard-IP ACL
¾ Create Standard-IP ACL
Mask
Extend-IP ACL
¾ Create Extend-IP ACL
Policy Config
Policy Summary
Select Policy
Policy Create
Action Create
Desired policy, please click the Delete button
11 Action Create
¾ Create Action
Port Binding
Policy Binding
Binding Table
¾ Policy Bind Table
Enter the ID of the Vlan you want to bind
Vlan Binding
Direction Displays the binding direction
Application Example for ACL
¾ VLAN-Bind Table
On ACL→ACL Config→ACL Create page, create ACL
On ACL→ACL Config→Standard-IP ACL page, select ACL
Network Security
IP-MAC Binding
Manual Binding
Protect Type Select the Protect Type for the entry
¾ Manual Binding Option
Enter the Vlan ID
¾ Manual Binding Table
ARP Scanning
End IP Address
Dhcp Snooping
Start IP Address
Scan
Network diagram for DHCP-snooping implementation
¾ Dhcp Working Principle
¾ Option
Dhcp Cheating Attack Implementation Procedure
¾ Dhcp Cheating Attack
163
Decline Threshold Decline Flow Control
¾ Option 82 Config
¾ Port Config Port Select
Customization Circuit ID Remote ID
¾ Cheating Gateway
ARP Inspection
¾ Imitating Gateway
10 ARP Attack Cheating Gateway
¾ Cheating Terminal Hosts
¾ Man-In-The-Middle Attack
¾ ARP Flooding Attack
¾ Trusted Port
ARP Detect
¾ ARP Detect
Network Security→ARP
ARP Defend
Required. On the Network Security→IP-MAC
Defend
ARP Statistics
¾ ARP Defend
Speed
IP Source Guard
¾ Illegal ARP Packet
¾ IP Source Guard Config
DoS Defend
DoS Attack Type Description
DoS Defend
DoS Detect
Detect
11.5
Detect Time
Attack Type
¾ The Mechanism of an 802.1X Authentication System
¾ 802.1X Authentication Procedure
178
179
¾ 802.1X Timer
¾ Guest Vlan
Guest Vlan
Authentication Method
802.1X
Guest Vlan ID
Retry Times
Supplicant Timeout
Server Timeout
Control Type
Control Mode
Radius Server
Authorized
Required. On the Network Security→802.1X→Radius
On the Network Security→802.1X→Global Config
802.1X Client Software
Required. On the Network Security→802.1X→Port
¾ Snmp Management Frame
Snmp
¾ Snmp Overview
¾ Snmp Versions
¾ Snmp Configuration Outline
¾ MIB Introduction
¾ Remote Engine
Snmp Config
¾ Local Engine
View Type
Snmp View
MIB Object ID
View Name
¾ Group Config
Snmp Group
Snmp User
¾ Group Table
Privacy Mode
Auth Mode
Auth Password
Privacy Password
Snmp Community
¾ Community Config
Access
MIB View
Required. On the SNMP→SNMP Config→Global
Required. On the SNMP→SNMP Config→SNMP
¾ Community Table
On the SNMP→SNMP Config→SNMP
Notification
User
Timeout
UDP Port
Retry
Rmon Group Function
Rmon
¾ Rmon Group
¾ History Control Table
Event Config
History Control
Alarm Config
¾ Event Table
Rising Threshold
Variable
Sample Type
Rising Event
200
Cluster
¾ Cluster Role
¾ Introduction to Cluster
13.1 NDP
Neighbor Info
¾ Neighbor Info
NDP Summary
¾ Neighbor
¾ Port Status Displays the port number of the switch
NDP
Aging Time
NDP Config
Detail :
Device Table
Port Displays the port number of the switch
Ntdp
Displays NDP status of the current port
Ntdp Summary
Ntdp Summary
Ntdp Hops
Ntdp Config
Ntdp Interval Time
Cluster Summary
Enable
Cluster
¾ Global Cluster
¾ Global Config Cluster
¾ Cluster Config
¾ Member Info
Switch
11 Cluster Summary for Member Switch
¾ Role Change
Cluster Config
¾ Current Role
14 Cluster Configuration for Commander Switch
Member Config
16 Cluster Configuration for Individual Switch
Device Name
Cluster Topology
¾ Create Member
Member MAC
18 Collect Topology
¾ Graphic Show
Application Example for Cluster Function
On Cluster→NDP→NDP Config page, enable NDP
On Cluster→NTDP→NTDP Config page, enable
220
CPU Monitor
Maintenance
System Monitor
Memory Monitor
14.2 Log
Time
Content
Log Table
Module
Remote Log
¾ Local Log Config
Local Log
Log Buffer
Host IP
Backup Log
¾ Log Host
Cable Test
¾ Backup Log
Device Diagnose
¾ Cable Test
Loopback
Error
Switch is available
Length
Ping
¾ Ping Config
Network Diagnose
Test
¾ Tracert Config
Tracert
Configure the Hyper Terminal
System Maintenance via FTP
Hardware Installation
232
Download Firmware via bootrom menu
5Port Settings
TP-LINK ifconfig ip 172.31.70.22 mask 255.255.255.0 gateway
TP-LINK upgrade You can only use the port 1 to upgrade
TP-LINK start Start User Access Login
Appendix a Specifications
Appendix B Configuring the PCs
Configure TCP/IP component
238
Now
Installation Guide
Appendix C 802.1X Client Software
241
242
Uninstall Software
Figure C-7 InstallShield Wizard Complete
Configuration
Figure C-10 Uninstall Complete
245
Figure C-15 Connection Status
FAQ
Appendix D Glossary
Ieee 802.1D
Multicast Switching
Group Attribute Registration Protocol Garp
Ieee 802.1Q
Link Aggregation
Port Authentication
Remote Authentication Dial-in User Service Radius
Link Aggregation Control Protocol Lacp
Spanning Tree Algorithm STA
Simple Network Management Protocol Snmp
Simple Network Time Protocol Sntp
Telnet