Manuals
/
Waves
/
Home Audio
/
Stereo Receiver
Waves
L3-LL
user manual
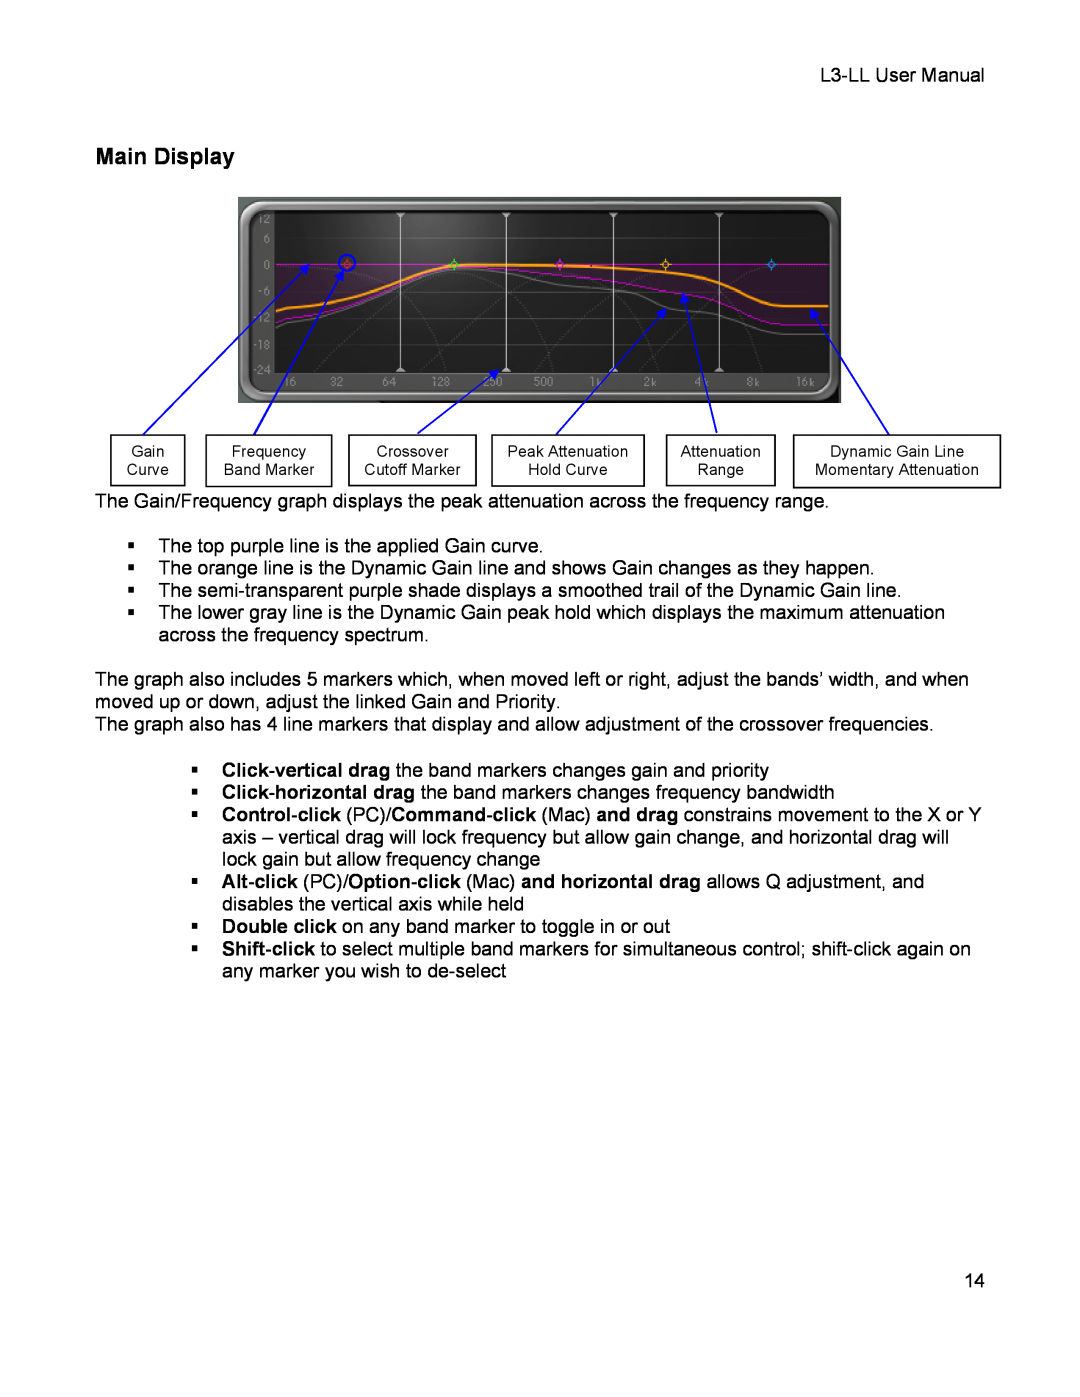
Main Display
Models:
L3-LL
1
14
26
26
Download
26 pages
4.2 Kb
11
12
13
14
15
16
17
18
Priority Indicators
Preset Handling
Default 0dB
Page 14
Image 14
Page 13
Page 15
Page 14
Image 14
Page 13
Page 15
Contents
L3-LLMultimaximizer
Page
TABLE OF CONTENTS
Chapter 1 - Introduction
1.1 Welcome
1.2 Product Overview
Page
Gain and Priority
1.3 Concepts and Terminology
The Peak Limiting Mixer
Separation
1.4 Components
L3-LLRelease Behavior
Chapter 2 - Quickstart Guide
Threshold/Input Meter
Chapter 3 - Controls and Interface
3.1 Global Limiter Section
Attenuation Meter
Out Ceiling/Output Meter
Threshold/Out Ceiling Link
Ultramaximizer Profiles
Ultramaximizer Release
Range x0.1 to
3.2 Graph Display and Controls Section
Main Display
Crossover Xover Controls
Band Controls
Separation
Per Band Solo
Gain/Priority Link
Priority Indicators
Gain
Priority
Master Release
Default ARC
Quantize
IDR Active Indicator
3.3 IDR Section
Dither
Chapter 4 - The WaveSystem
4.2 Preset Handling
Preset Types
4.1 The WaveSystem Toolbar
Put into Preset Menu As…
Loading Presets and Setups
Saving Presets and Setups
Save to New File…
A/B Comparison and Copying
Deleting Presets
4.3 Interface Controls
Toggle Buttons
Band Markers
Value Window Buttons
Faders
Click-verticaldrag changes gain
Multiple Selection of Controls
TAB Functions
Appendix A - Controls List
IDR Dither Options
Appendix B - IDR In Depth
Dithering and Noise Shaping
Type1
Moderate
IDR Noise Shaping Options
Type2
Normal
Top
Page
Image
Contents