Menu Bar | Using the Power Sensor |
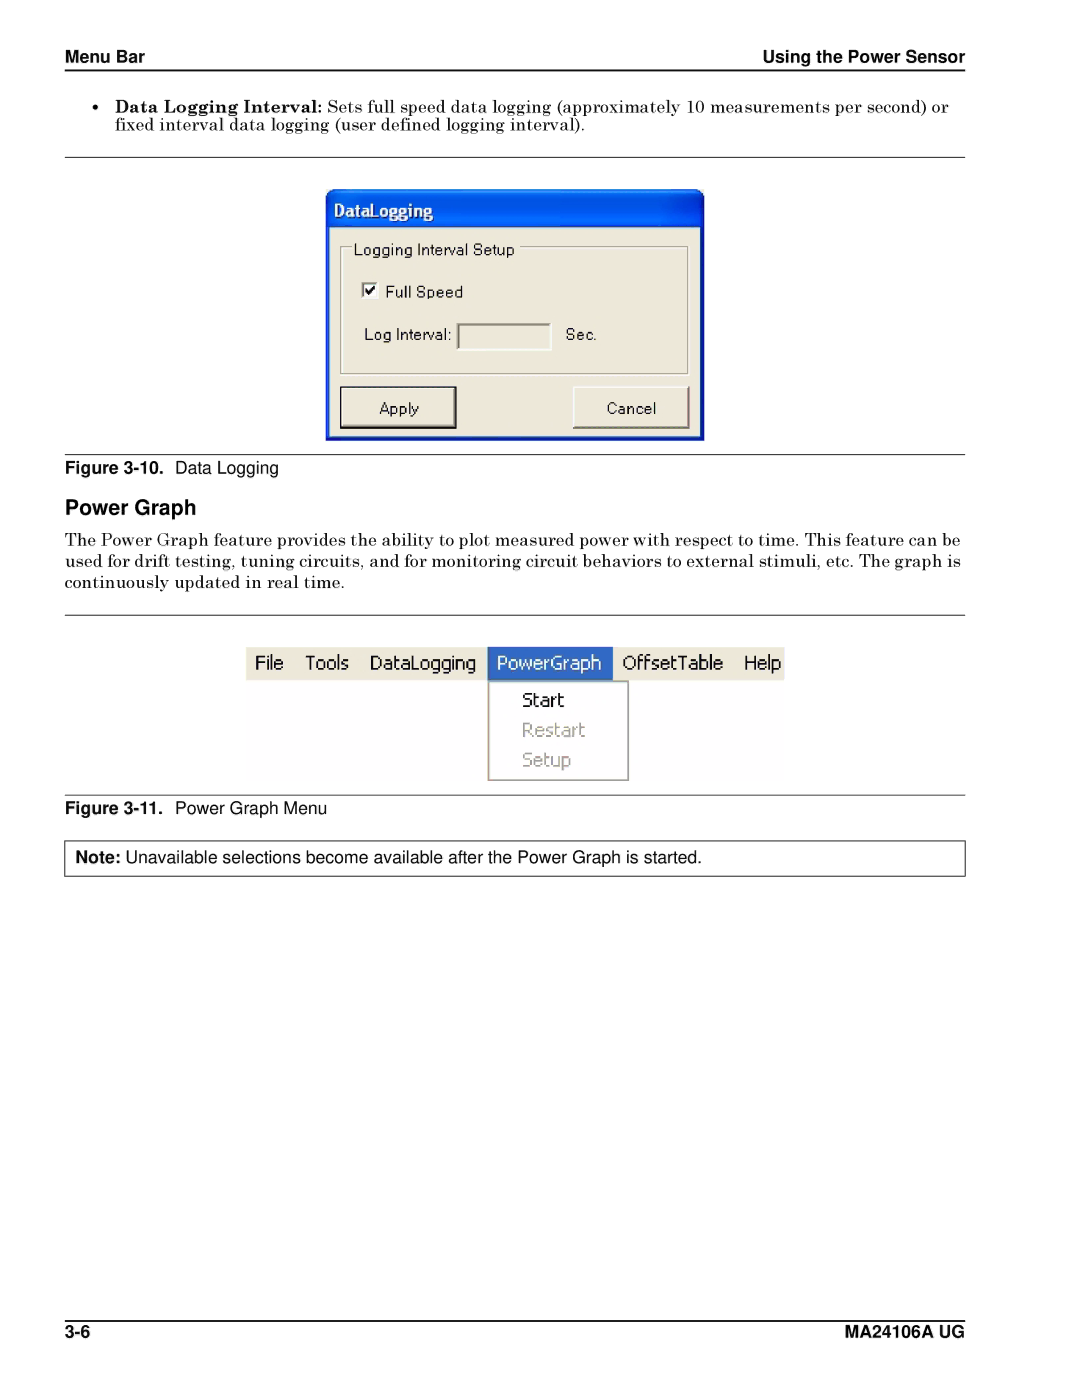
•Data Logging Interval: Sets full speed data logging (approximately 10 measurements per second) or fixed interval data logging (user defined logging interval).
Figure 3-10. Data Logging
Power Graph
The Power Graph feature provides the ability to plot measured power with respect to time. This feature can be used for drift testing, tuning circuits, and for monitoring circuit behaviors to external stimuli, etc. The graph is continuously updated in real time.
Figure 3-11. Power Graph Menu
Note: Unavailable selections become available after the Power Graph is started.
MA24106A UG |