Using the Power Sensor | Measurement Considerations |
High Crest Factor Signals (peak to average ratio)
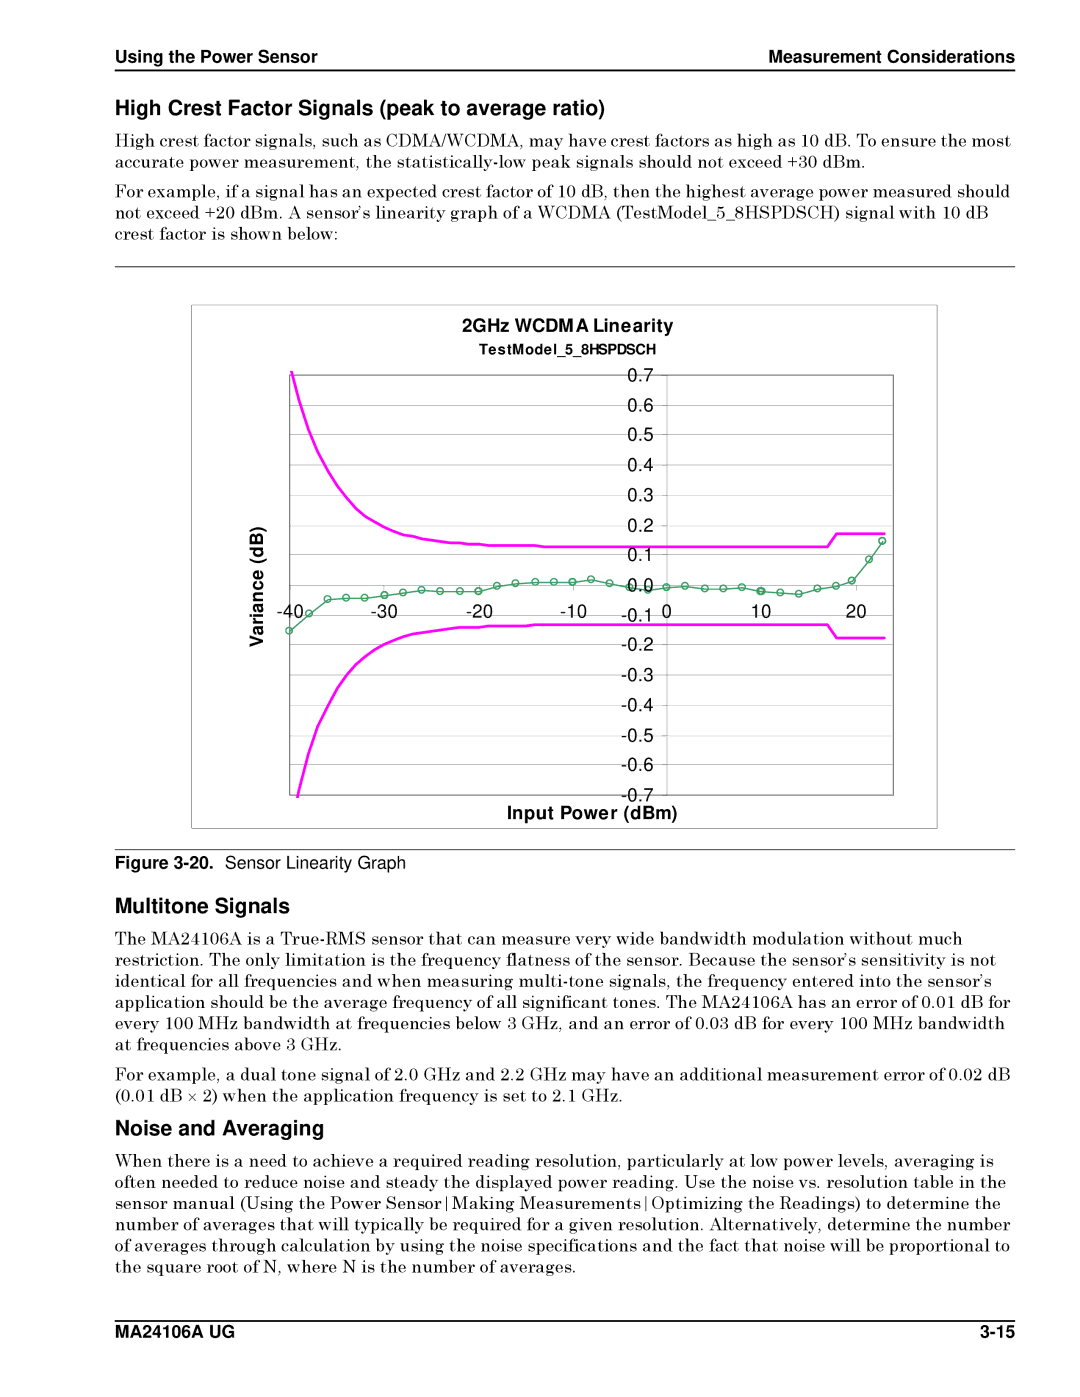
High crest factor signals, such as CDMA/WCDMA, may have crest factors as high as 10 dB. To ensure the most accurate power measurement, the
For example, if a signal has an expected crest factor of 10 dB, then the highest average power measured should not exceed +20 dBm. A sensor’s linearity graph of a WCDMA (TestModel_5_8HSPDSCH) signal with 10 dB crest factor is shown below:
|
|
| 2GHz WCDMA Linearity |
|
| ||
|
|
| TestModel_5_8HSPDSCH |
|
| ||
|
|
|
|
| 0.7 |
|
|
|
|
|
|
| 0.6 |
|
|
|
|
|
|
| 0.5 |
|
|
|
|
|
|
| 0.4 |
|
|
|
|
|
|
| 0.3 |
|
|
(dB) |
|
|
|
| 0.2 |
|
|
|
|
|
| 0.1 |
|
| |
Variance |
|
|
|
| 0.0 |
|
|
10 | 20 | ||||||
|
|
|
|
|
| ||
|
|
|
|
|
|
| |
|
|
|
|
|
|
| |
|
|
|
|
|
|
| |
|
|
|
|
|
|
| |
|
|
|
|
|
|
| |
|
|
|
|
|
|
| |
|
|
|
| Input Power (dBm) |
|
| |
Figure 3-20. Sensor Linearity Graph
Multitone Signals
The MA24106A is a
For example, a dual tone signal of 2.0 GHz and 2.2 GHz may have an additional measurement error of 0.02 dB (0.01 dB ⋅ 2) when the application frequency is set to 2.1 GHz.
Noise and Averaging
When there is a need to achieve a required reading resolution, particularly at low power levels, averaging is often needed to reduce noise and steady the displayed power reading. Use the noise vs. resolution table in the sensor manual (Using the Power SensorMaking MeasurementsOptimizing the Readings) to determine the number of averages that will typically be required for a given resolution. Alternatively, determine the number of averages through calculation by using the noise specifications and the fact that noise will be proportional to the square root of N, where N is the number of averages.
MA24106A UG |