Bridging
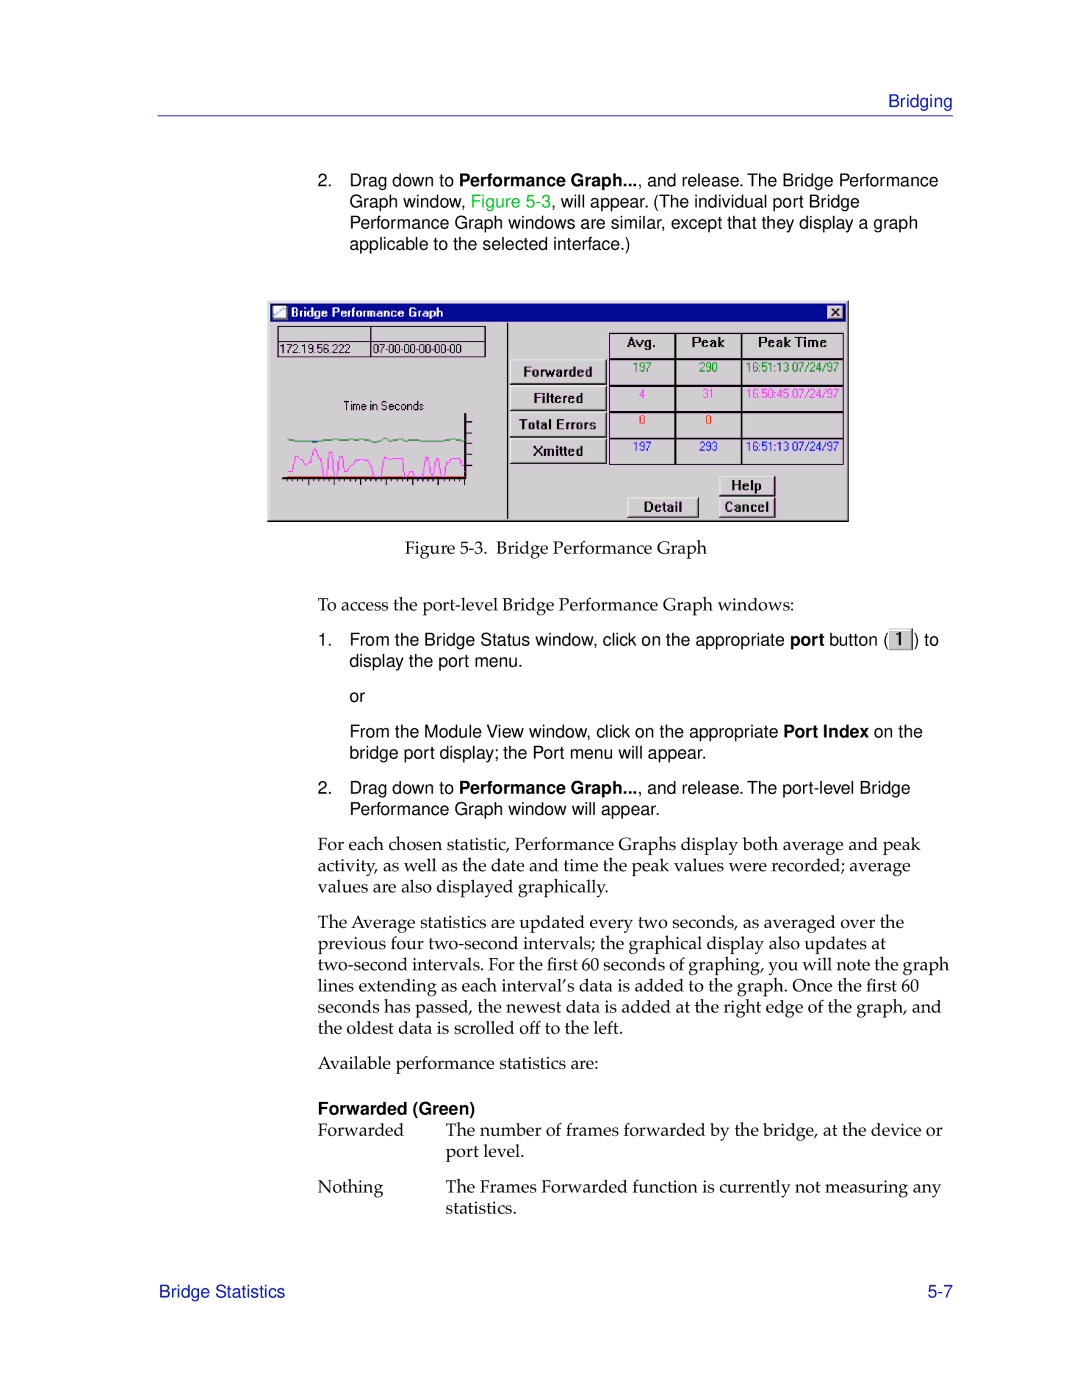
2.Drag down to Performance Graph..., and release. The Bridge Performance Graph window, Figure
Figure 5-3. Bridge Performance Graph
To access the port-level Bridge Performance Graph windows:
1.From the Bridge Status window, click on the appropriate port button (![]() ) to display the port menu.
) to display the port menu.
or
From the Module View window, click on the appropriate Port Index on the bridge port display; the Port menu will appear.
2.Drag down to Performance Graph..., and release. The
For each chosen statistic, Performance Graphs display both average and peak activity, as well as the date and time the peak values were recorded; average values are also displayed graphically.
The Average statistics are updated every two seconds, as averaged over the previous four
Available performance statistics are:
Forwarded (Green)
Forwarded The number of frames forwarded by the bridge, at the device or port level.
Nothing | The Frames Forwarded function is currently not measuring any |
| statistics. |
Bridge Statistics |