CanoCraft FS
Two Ways to Learn About CanoCraft FS
Users Guide
Quick Start Jump right into scanning Steps 1-3 Methodical approach
Getting Started
How to Make Best Use of the Manuals
When you open the box
Product Guide
Step 1 Basic Procedures
How to Use the Users Guide
How to Use this Guide
Step 3 Adjusting Images
Quick Start Jump Right into Scanning
Table of Contents
Step 1 Basic Procedures
Step 2 Scanning
Adjusting Highlights and Shadows Easy Mode
Step 3 Adjusting Images
Changing the Adjustment Mode
Adjusting a Histogram Expert Mode
Resetting Default Settings
Other Functions
Editing
Adjusting an Image
Copying with CanoCraft FS Copy
Appendices
Trademarks
Example Click File and select Preview or click the Preview button
Conventions Used in this Guide
Names and Examples
Example
Scanning Software that Can Perform Image Processing
CanoCraft FS Features
Help with How to Use the Program is Always at Hand
Simple User Interface
Quick Start
Jump Right into Scanning
3. Select a Scanning Method
1. Install CanoCraft FS
2. Start CanoCraft FS
4. Insert the film
6. Adjust the Brightness and Coloring
5. Preview Scan
Easy Mode
9. Print
7. Specify the Scan Area
8. Scan and Save
Click and drag the mouse cursor over the area of the preview scan that you wish to include in the final image
Basic Procedures
Step
Turn the scanner and computer power on in that order
Installing CanoCraft FS
Installing CanoCraft FS
Follow the on-screen instructions to complete the remaining steps
Precautions When Connecting the Scanner to a Windows 95 Computer
If your is the new version of Windows 95, click the Next button without inserting anything into the drive. In the next window that displays, click the Finish button
Starting and Closing CanoCraft FS
Starting CanoCraft FS from the Windows Desktop
Plug in the scanner, turn on your computer and start Windows
Closing CanoCraft FS
Starting CanoCraft FS from Photoshop TWAIN- Compliant Application
Program Window Names and Functions
CanoCraft FS Program Window
CanoCraft FS Copy Program Window
CanoCraft FS Copy and CanoCraft FS cannot be run simultaneously
Settings Display Area Pop-Up Menu
CanoCraft FS Menu Commands
Menu Bar Pull-Down Menus
Select the expert mode for adjusting color
Step 1 Basic Procedures Image
Selects the easy mode for adjusting color
Sets the scanner model in a multiple scanner configuration
How to Find Out More About a Procedure You Dont Understand
Scanning
Adjust the color balance, halftone pattern or threshold values. p
Scanning Procedures
Determine the image size and resolution. pp
Set the film type. p
24-bit color and 36-bit color images are expressed in varying values of each color red, green and blue RGB. 24-bit color images are expressed in 256 colors per RGB channel. 36-bit color images use 4096 colors. Use the 24-bit color setting for most images unless you require particularly fine color definition
Selecting the Film Type
Selecting the Image Type
Determining the Image Format
Selecting Resolution and Magnification Settings
About Resolution and Magnification
Selecting a Scan Resolution Setting
Data Volume Varies with Scan Resolution
Selecting an Output Resolution Setting
Output Resolution Settings Dialog
Procedures for Setting the Output Resolution
Raises the magnification
Printing with Monochrome Printers and Color LBPs
Determining the Input and Output Resolution and Output Magnification
Printing with Bubble Jets, Ink Jets and Other Color Printers
Display on a Computer Monitor
Previewing
Zooming an Image for Verification
Rotating the Image to Change Its Orientation
Rotate/Flip Dialog
Adjusting Brightness and Coloring
Selecting the Scan Area
Selecting the Scan Area
Changing the Scan Area Selection
Unlocked State
Selection Frame in the Preview Window
Locked State
Output Resolution Settings Display Area
Output Size/Units Preview Window Top
Output Resolution Settings Display Area
Fixing the Aspect Ratio
Aspect Ratio Dialog
Final Scan and Saving
About File Formats
Histogram Tab of the Adjust Dialog
Adjusting Images
Adjust the
Set the adjustment mode to expert mode
Set the adjustment mode to easy mode
To Obtain Better Images
Adjust the Gamma Values
Which requires adjustment? Brightness or Coloring?
Adjust with
Adjust the Color Balance
Image Adjustment Commands
Adjusting Tone Curves Expert Mode p
Adjusting Color Balance Expert Mode p
Changing the Adjustment Mode
Easy Mode Categories
Expert Mode Categories
Adjusting Brightness and Coloring Easy Mode
Brightness Tab
Coloring Tab
Adjusting Highlights and Shadows Easy Mode
Brightness Tab
Adjusting a Histogram Expert Mode
Histogram Tab
How to Interpret a Histogram
How to Adjust a Histogram
Image Image Image
Page
Adjusting Brightness/Contrast Expert Mode
Brightness/Contrast Tab
Adjusting Brightness
Adjusting Contrast
Adjusting Gamma Values Expert Mode
Gamma Value Tab
Setting the Gamma Value Correctly
Display Gamma Value vs. CanoCraft FS Gamma Value
Adjusting a Tone Curve Expert Mode
Tone Curve Tab
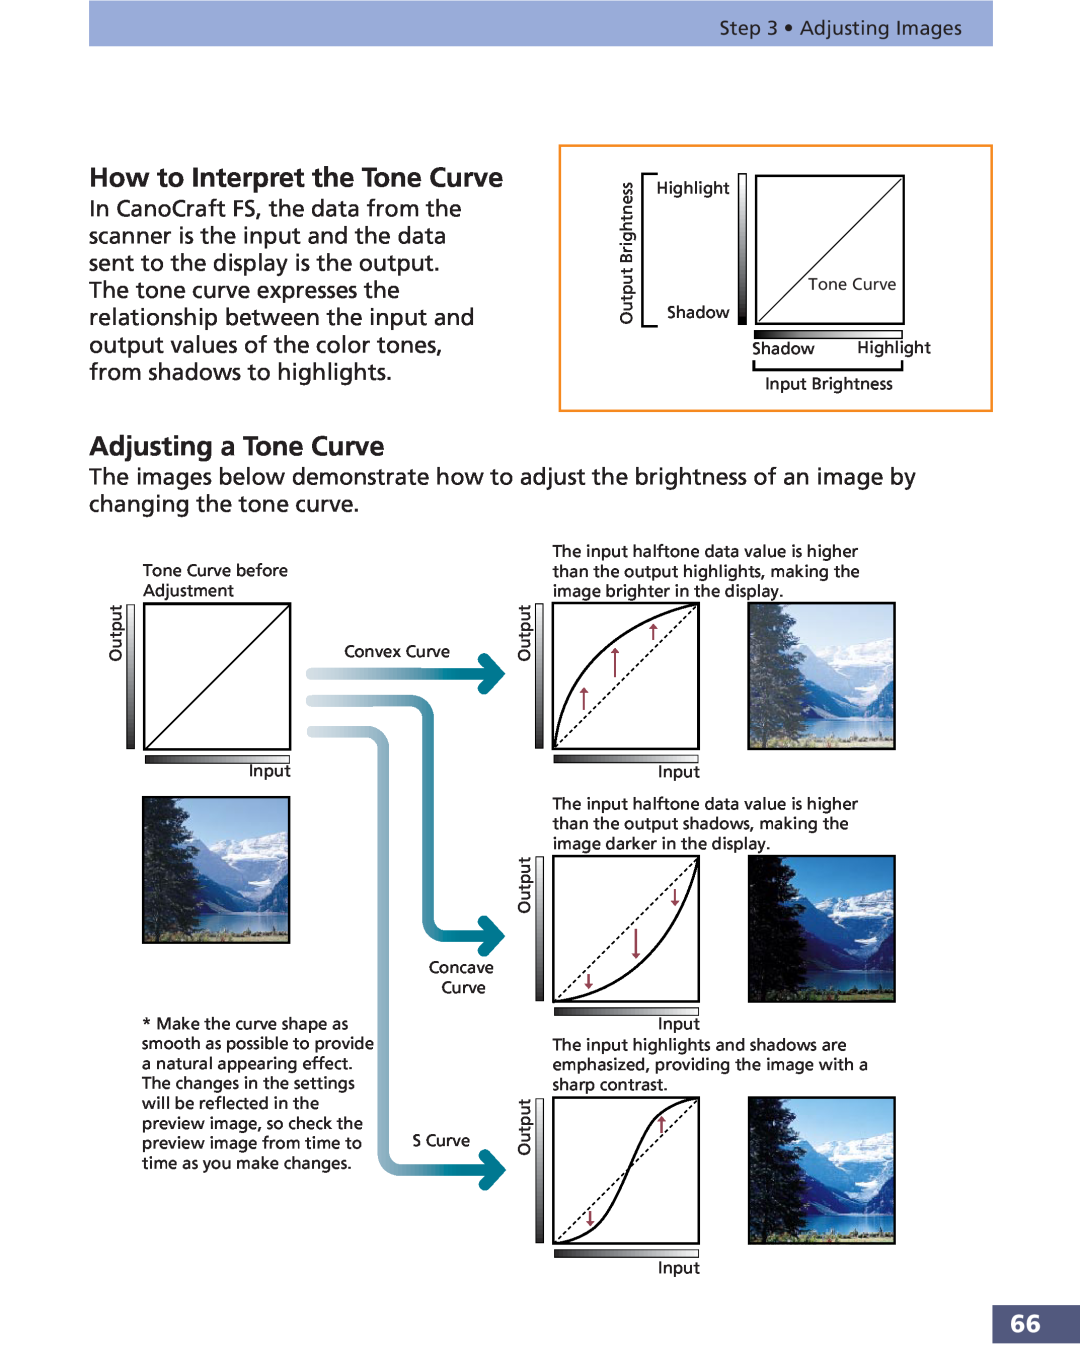
How to Interpret the Tone Curve
Adjusting a Tone Curve
S Curve
Adjusting the Color Balance Expert Mode
Color Balance Tab
Step 3 Adjusting Images Red is accentuated Green is accentuated
Blue is accentuated
XXX YYY
Adjusting Threshold Settings Easy/Expert Mode
Threshold Tab
Adjusting the Exposure Settings
Exposure Adjustment Dialog
Under-Exposed
About Film Types CanoScan 2700F Users
Neutral Exposure
Dialog for the CanoScan 2700F
Adjusting the Focus
Focus Settings Dialog
Other Functions
Save Preview Image
CanoCraft FS Preference Settings
Set the Exposure and Autofocus Settings for Final Scan
Single Scan
ColorGear Color Matching
Resetting Default Settings
Default Categories and Settings
Printing
Print Dialog
Printer Setup
Sending a Fax
Printer Dialog
Fax Setup
Selecting the Scanner
Scanner Selection Dialog
Scanner Self-Test
Self-Test Dialog
Viewing Version Data
Editing
Copying to the Clipboard
Copying an Image
Clearing the Clipboard
Undoing the Previous Action
Redoing an Action After the Undo Command
Redoing an Edit
Undo All
Adjusting an Image
Procedures Click the Effect menu and select Sharpen
Sharpening an Image
Procedures Click the Effect menu and select Soften
Blurring an Image
Procedures Click the Effect menu and select Despeckle
Removing Noise
Procedures Click the Effect menu and select Invert
Inverting an Image
Find the Edges
Procedures Click the Effect menu and select Edges
Formatting an Image
Click the OK button to accept the effect
Procedures
Find Lines
Click the Effect menu and select Lines
Procedures Click the Effect menu and select Pixelize
Pixelate
Procedures Click the Effect menu and select Posterize
Posterize
Low Relief
Click the Effect menu and select Low Relief
Procedures Click the Effect menu and select Halftone
Halftone
Click the File menu and select Open
Procedures for Loading a Saved File
Editing a Saved File
Select the desired file and click the Open button
Procedures Click the File menu and select Save As
Saving a File After Editing
Input a new file name and click the Save button
Deleting a File after Editing
Click the File menu and select Close
Copying with CanoCraft FS Copy
CanoCraft FS Copy and CanoCraft FS cannot be run simultaneously
Procedures for Opening CanoCraft FS Copy
Displaying the Copy Window
Turn the computer on and start Windows
Copying Procedures
Copying
Insert the film into the scanner
Select a film type
Select an image type
Select the Color or Grayscale setting to match your film
Adjust the brightness, if required
Select the number of copies to output, if required
The film will be scanned and the image will print
To close CanoCraft FS Copy, click the close box
Adjusting CanoCraft FS Copy Settings
Changing the Printer Settings
Click the OK button once you are satisfied with the settings
Changing the Scanner Settings
Adjust the settings as required and click the OK button
Exposure
Scan Resolution
Film Type
Focus
Adjust Alt + A
Preferences
Version Information
tips for installing and operating CanoCraft
Appendices
The appendices include troubleshooting
how to uninstall the software, a glossary
Setup initialization error message displays
Troubleshooting
Problems with Software Installation Installation is unsuccessful
Insufficient space on install drive message displays
Scanner not detected message displays
Problems Starting Software Programs
Problem with SCSI adapter or its software message displays
Specified device not found message displays
Initializing film scanner. Please remove film message displays
Problems with Scanning
Can’t start CanoCraft FS from within another application
Image is vertically or horizontally inverted
Preview image coloring is strange
when negative films are scanned
Cannot achieve the desired coloration despite having adjusted the
Colors sometimes appear at the boundaries of highlights and shadows
A scan with the image type set to black and white results in an image
Image Quality Problems Scan quality is poor
change with each scan
that is whited out or too dark
Low disk space condition message displays, file cannot be saved
Problems Saving Images
Problems with Printing Printing fails or printing errors
Cannot open saved file in an application program
Uninstalling CanoCraft FS
Click the Yes button
Uninstalling with the Install/Uninstall Software Menu on the CD-ROM
Select Install/Uninstall Software from the menu
Click the OK button
Procedures Double-click the CanoCraft FS Automatic Configuration icon
Configuring CanoCraft FS
CanoCraft FS Automatic Configuration
Read the message and click the OK button
CanoCraft FS Configuration
Procedures Double-click the CanoCraft FS Configuration icon
Monitor Settings
Printer Configuration
Copy Configuration
The settings window for the attached installed printer will display
Click the Close button after you have finished adjusting the settings
Fax Configuration
Configured Devices
Film Manufacturer
List of Film Types
35 mm Film
Film
IX240 Film
Film Manufacturer
12-Bit Grayscale Image
Glossary
8-Bit Grayscale Image
24-Bit Color Image
Color Balance
Black and White
Brightness
Color Image
Gamma Curve
Film Base Color
Gamma Correction
Grayscale
Scan
Resolution
Image File
Threshold
Symbols
Index
40, 55, 57, 58, 61, 63, 65, 67, 69, 110 Adjust Button
Focus 72
Help 24
Scan Resolution 22, 32, 33, 108
CANON DEUTSCHLAND GmbH
Customer Support Help Desk
CANON FRANCE S.A
CANON ITALIA S.p.A
CANON NORGE AS
CANON SVENSKA AB
BRUHN A.S
CANON BENELUX NEDERLAND B.V
CANON LATIN AMERICA, INC
CANON EUROPA N.V
CANON INC