SRP-280N/SRP-285N
Before starting calculation
Unit Conversions Physical Constants
Mode 1 Stat
General Guide
„ Battery Replacement
„ Auto Power-Off Function
„ Reset Operation
Entry line
„ Contrast Adjustment
Indicator Meaning
„ Display Readout
„ Selecting an item from display menus
„ Changing a mode
„ Using 2nd Keys
Before starting calculation
„ Memory Calculation
„ Error Position Display Function
„ Making corrections during input
„ Replay function
RANDM, Randmi
„ Order Of Operations
„ Accuracy And Capacity
DMS
OCT
„ Error Conditions
DEC
BIN
„ Parentheses Calculation
Mode 0 Main
„ Arithmetic Calculations
„ Display formats
„ Logarithm And Antilogarithm
„ Percentage Calculation
„ Continuous calculation function
„ Answer Function
„ Angle Unit Conversion
„ Probability
„ Trigonometric / Inverse-Tri. Functions
„ Hyperbolic / Inverse-Hyp. Functions
„ Coordinates Transformation
„ Physical Constants
Symbol Meaning Value
„ Other Functions x-1, √, X , x
„ Unit Conversions
Xmin or Ymin
Mode 1 Stat
„ Single-Variable / Two-Variable Statistics
VariableMeaning
Σx y
„ Process capability
„ Probability distribution
Σx 2 or Σy
„ Correcting data
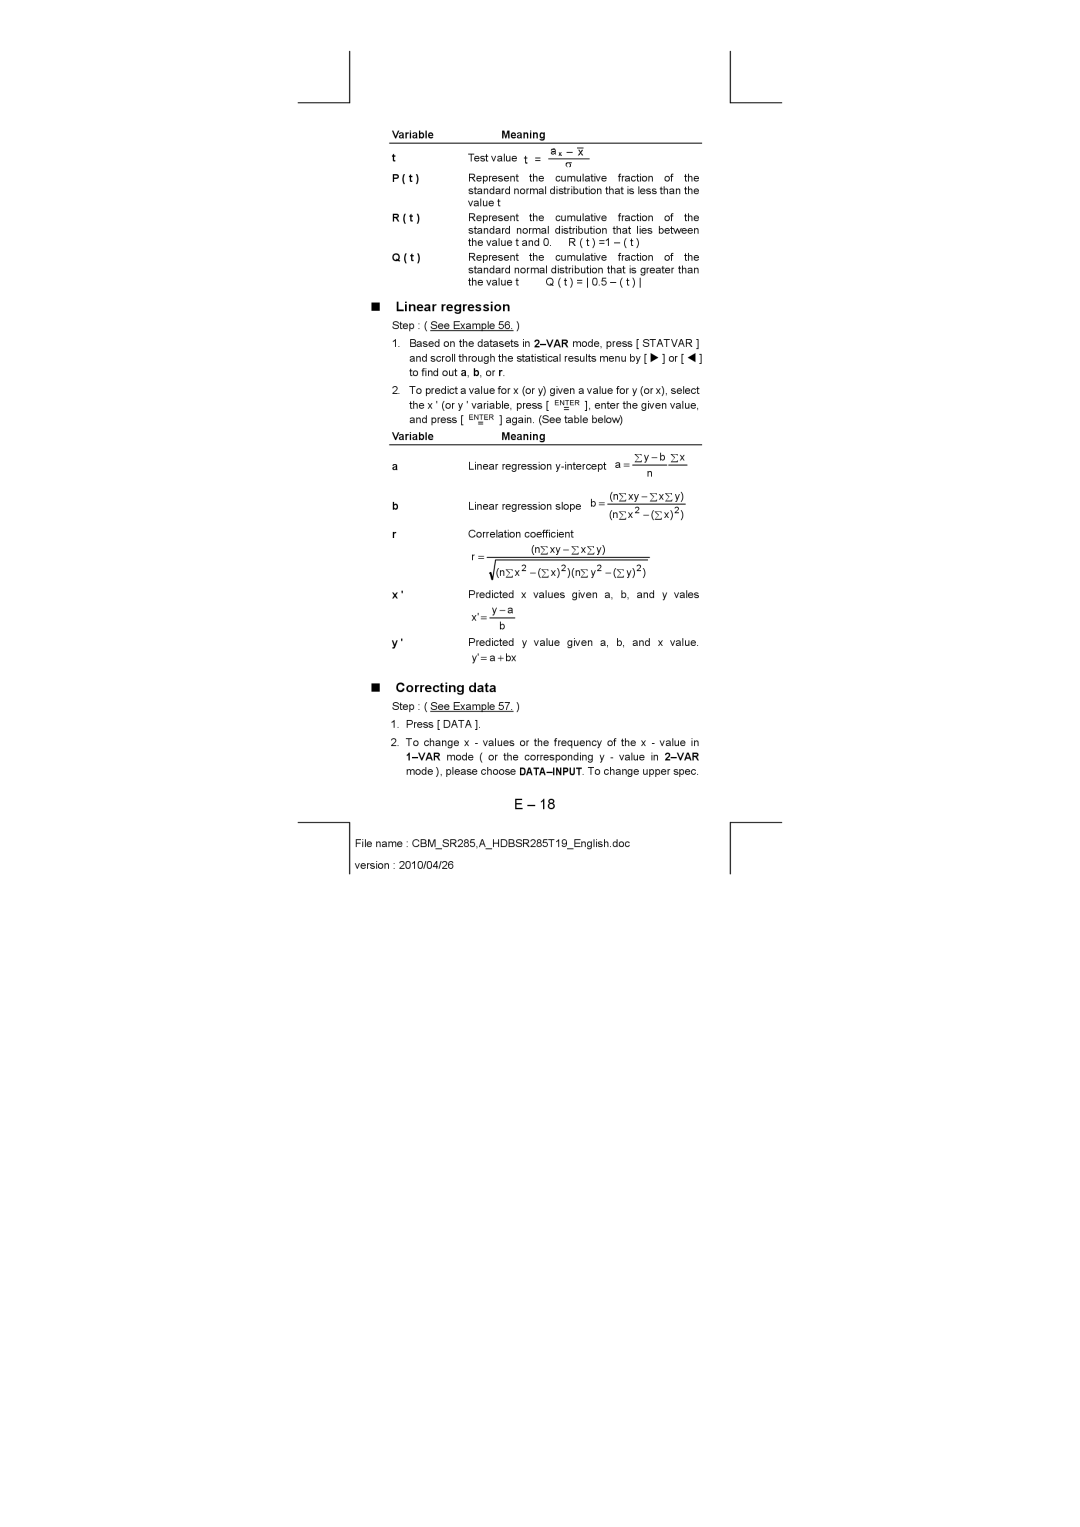
„ Linear regression
Variable Meaning
„ Bases conversions
Mode 2 Base-n
„ Negative expression
„ Basic arithmetic operations for bases
Mode 3 Cplx
Mode 4 VLE
Mode 5 QE
Antes de empezar los cálculos
Guía GeneraI
Transformación de las coordenadas
Mode
Otras funciones Conversión de la unidad
„ Función auto desactivadora
Guía GeneraI
„ Encendiendo o apagando
„ Reemplazo de batería
2nd
„ Ajuste del contraste
„ Lectura de la visualización
Indicador Significado
„ Usando teclas 2nd
Antes de empezar los cálculos
„ Seleccionando un modo
„ Seleccionando un elemento de los menús de visualización
„ Haciendo correcciones durante la entrada
„ Función de visualización de la posición de error
„ Función de respuesta
„ Orden de operaciones
„ Función de memoria
„ Exactitud y Capacidad
DD, MM, SS.SS < 1 x
OCT
„ Condiciones de error
„ Formatos de visualización
„ Cálculo aritmético
„ Cálculos de paréntesis
„ Cálculo de fracción
„ Cálculo de porcentaje
„ Función del cálculo continuo
„ Logaritmos y Antilogaritmos
„ Conversión de unidades de ángulo
„ Probabilidad
„ Funciones trigonométricas / Tri. Inversas
„ Funciones Hiperbólicas / Hip. Inversas
„ Transformación de las coordenadas
Símbolo Significado Valor
„ Otras funciones x-1, √, X , x
„ Conversión de la unidad
„ Constantes de Física
Variable Significado
„ Variable Sencilla / Estadísticas con Dos Variables
Σx 2 o Σy
„ Capacidad de Proceso
„ Distribución de probabilidad
Σx o Σy
VariableSignificado
„ Regresión lineal
„ Conversiones básicas
„ Corregiendo dados
„ Expresiones negativas
„ Operaciones lógicas
„ Operaciones aritméticas básicas para bases
Guia Geral
Constantes de Física
Outras funções
„ Função auto desligante
Guia Geral
„ Ligando ou desligando
„ Substituição de pilha
„ Leitura do mostrador
„ Ajuste de Contraste
„ Selecionando um modo
Antes de começar cálculos
„ Selecionando um item dos menus exibidos
„ Função de Repetição
„ Fazendo correções durante entrada de dados
„ Função de exibição da posição de erro
„ Ordem de operações
„ Função de memória
„ Precisão e Capacidade
≤ x ≤ 69, x é um inteiro
„ Condições de Erro
„ Cálculos de parênteses
„ Formatos de exibição
„ Logaritmos e Antilogaritmos
„ Cálculos de porcentagem
„ Função de cálculo contínuo
„ Função de resposta
„ Funções Trigonométricas / Trig. Inversas
„ Conversão de unidades de ângulo
„ Funções Hiperbólicas / Hip. Inversas
„ Conversão de unidade
„ Transformação de coordenadas
„ Probabilidade
„ Outras funções x-1, √, X , x
Mode 1 Stat
„ Capacidade de Processo
„ Variável Simples / Estatísticas com Duas-variáveis
„ Distribuição de Probabilidade
„ Corrigindo dados
„ Regressão linear
Variável Significado
„ Operações lógicas
„ Conversões bases
„ Expressões negativas
„ Operações aritméticas básicas para bases
Mode 3 Cplx
Vor dem Rechnen
Allgemeine Hinweise
Andere Funktionen
„ Automatisches Ausschalten
Allgemeine Hinweise
„ Ein- und Ausschalten
„ Auswechseln der Batterien
„ Bildschirmanzeige
„ Einstellung des Kontrats
Anzeige Bedeutung
„ Die 2nd Funktion
Vor dem Rechnen
„ Auswahl eines Modes
„ Auswahl aus der Bildschirmanzeige
„ Fehlerkorrektur während der Eingabe
„ Die Positionsanzeiger
„ Die Wiedergabefunktion
„ Rechnen mit dem Speicher
„ Die Funktionsanzeige Fehlerposition
„ Reihenfolge der Rechenoperationen
„ Korrektheit und Kapazität
DMS
Domain Er
„ Fehlerbedingungen
Length Er
„ Arithmetische Berechnungen
„ Bildschirmformate
Overflow Er Stat Er Syntax Er
„ Rechnen mit Prozentsätzen
„ Rechnen mit Klammern
„ Berechnung von Brüchen
„ Kontinuierliche Rechenfunktionen
„ Antwortfunktionen
„ Logarithmen und Antilogarithmen
„ Trigonometrische und invers- trigonometrische Funktionen
„ Umrechnung von Winkeleinheiten
„ Hyperbolische und invers-hyperbolische Funktionen
„ Umwandlung in andere Einheiten
„ Umwandlung in andere Koordinaten
„ Wahrscheinlichkeiten
„ Andere Funktionen x-1, √, X , x
„ Physikalische Konstanten
Symbol Bedeutung Wert
„ Einzelne-Variable / Zwei-Variablen Statistik
Cpx oder Cpy
„ Verarbeitungsvermögen
„ Wahrscheinlichkeitsverteilung
Variable Bedeutung Cax oder Cay
„ Daten korrigieren
„ Lineare Regression
VariableBedeutung
„ Negative Ausdrücke
„ Grundlegende Umwandlungen
„ Logische Berechnungen
„ Grundlegende arithmetische Berechnungen für Basen
Realwert Imaginärer Wert Absoluter Wert Argument-Wert
Avant de Commencer le Calcul
Guide Général
Corriger des données
Transformation de Coordonnées
Autres Fonctions
Constante de Physique
„ Fonction Arrêt Automatique
Guide Général
„ Mettre en Marche ou Eteindre
„ Changement des Piles
Indicateur Sens
„ Ajustement de Contraste
„ Lecture d’Affichage
Ligne d’Entrée
„ Utiliser les Touches 2nd
„ Changer de Mode
Avant de Commencer le Calcul
„ Sélectionner un Elément depuis les Menus d’Affichage
„ Calcul avec Mémoire
„ Effectuer des Corrections durant une Entrée
„ Fonction de Répétition
„ Fonction d’Affichage de Position d’Erreur
„ Ordre des Opérations
„ Précision et capacité
DMS DD, MM, SS.SS
„ Calcul Arithmétique
„ Condition d’Erreur
„ Claculs avec Parenthèses
„ Formats d’Affichage
„ Logarithmes et Antilogarithmes
„ Calculs avec Pourcentages
„ Fonction de Calcul Continu
„ Fonction de Réponse
„ Fonctions de Trigonométrie / Tri. Inversée
„ Conversion des Unités Angulaires
„ Fonctions d’Hyperbole / Hyperbole Inversée
„ Conversion d’Unité
„ Transformation de Coordonnées
„ Probabilité
„ Autres Fonctions x-1, √, X , x
„ Constante de Physique
Symbole Sens Valeur
„ Statistiques à Variable Unique / Double
VariableSens
„ Capacité de traitement
Variable Sens
„ Régression linéaire
„ Distribution de probabilité
„ Corriger des données
„ Opération Logique
„ Conversions de Base
„ Expressions Négatives
„ Opérations Arithmétiques de Base pour Bases
Mode 3 Cplx
Funzione di calcolo continuo
Funzione di posizione dellerrore Calcoli con la memoria
Cambio della modalità Selezione di una voce dai menù su
Correzioni durante la battitura
Costanti fisiche
Modalità 1 Statistiche
Guida Generale
Linea del risultato
Indicatore Significato
„ Schermo
Linea di immissione
Prima di iniziare i calcoli
„ Funzione Replay
„ Funzione di posizione dellerrore
„ Calcoli con la memoria
„ Ordine delle operazioni
„ Accuratezza e Capacità
VAR n ≤ 50, 2-VAR n ≤
„ Formati di Visualizzazione
„ Condizioni di errore
Modalità 0- Main
„ Calcoli Aritmetici
„ Calcolo della Percentuale
„ Calcolo con Parentesi
„ Funzione di calcolo continuo
„ Conversione unità degli angoli
„ Funzione di risposta
„ Logaritmo e antilogaritmo
„ Calcolo di Frazione
„ Probabilità
„ Funzioni Trigonometriche / Trig. Inverse
„ Funzioni Iperboliche/ Ip. Inverse
„ Trasformazione delle Coordinate
Simbolo Significato Valore
„ Altre funzioni x-1, √, X ,x
„ Conversione di Unità
„ Costanti fisiche
„ Statistiche a Variabile Singola / Doppia
Modalità 1 Statistiche
Variabile Significato
Cpkx o Cpky
„ Capacità del Processo
Variabile Significato Cax o Cay
Cpx o Cpy
„ Regressione Lineare
„ Distribuzione di Probabilità
„ Correzione dei dati
Modalità 2 Base-n
„ Conversioni delle basi
Modalità 4 VLE
Modalità 3 Cplx
Modalità 5 QE
Page
Alvorens het uitvoeren van berekeningen
Algemene inleiding
Statistieken met één of twee variabelen
Functies Hyperbolische en inverse hyperbolische
Coördinaattransformatie
Andere functies Conversie van eenheden
„ De batterij vervangen
„ Automatisch uitschakelen Auto Power-Off
Algemene inleiding
„ Aan- en uitzetten
„ Het beeldscherm
„ Het contrast bijregelen
„ Een optie in het weergegeven menu kiezen
„ Een modus selecteren
„ De 2nd toetsen gebruiken
„ Verbeteringen maken tijdens het intoetsen
„ De cursor
„ De herhaalfunctie
„ Berekeningen met het geheugen
„ Foutieve invoer weergeven
„ Volgorde van de bewerkingen
„ Nauwkeurigheid en capaciteit
DD , MM, SS.SS < 1 x 10
„ Foutmeldingen
„ Rekenkundige bewerkingen
Modus 0 Main
„ Weergaveformaten
„ Antwoordfunctie
„ Berekeningen met haakjes
„ Procentberekening
„ Doorlopend berekenen
„ Bewerkingen met breuken
„ Logaritme en antilogaritme
„ Hoekconversie
„ Hyperbolische en inverse hyperbolische functies
„ Trigonometrische / inverse trigonometrische functies
„ Coördinaattransformatie
„ Constanten
„ Waarschijnlijkheid
„ Andere functies x-1, √, X , x
„ Conversie van eenheden
„ Statistieken met één of twee variabelen
Modus 1 Stat
Σx 2 of Σy
„ Procesbegrenzing
Variabele Betekenis
Σx of Σy
„ Lineaire regressie
„ Waarschijnlijkheidsdistributie
„ Gegevens corrigeren
„ Rekenkundige basisbewerkingen in andere getalbasissen
Modus 2 Base-n
„ Grondtalconversie
„ Negatieve uitdrukking
Modus 4 VLE
Modus 3 Cplx
Modus 5 QE
Generel vejledning
Mode 0 Main
Statistik med én variabel / to variabler
Hyperbolske / inverse hyperbolske
Koordinattransformation
Andre funktioner Enhedskonverteringer
Generel vejledning
Indikator Betydning
„ Displayets elementer
Indtastningslinjen
Resultatlinjen
„ Anvendelse af 2nd -tasterne
„ Ændring af tilstanden mode
Inden du går i gang med at foretage beregninger
„ Vælg en valgmulighed i displaymenuerne
„ Hukommelsesberegning
„ Foretag rettelser under indtastningen
„ Gentagelsesfunktionen
„ Displayfunktionen fejlposition
„ Operationsrækkefølge
„ Nøjagtighed og kapacitet
For tan θ, dog
„ Aritmetiske beregninger
„ Fejltilstande
„ Parentesberegninger
„ Displayformater
„ Logaritmer og antilogaritmer
„ Procentberegning
„ Fortløbende beregninger
„ Svarfunktion
„ Koordinattransformation
„ Konvertering mellem vinkelenheder
„ Trigonometriske / inverse trigonometriske funktioner
„ Hyperbolske / inverse hyperbolske funktioner
„ Andre funktioner x-1, √, X , x
„ Sandsynlighed
„ Enhedskonverteringer
„ Fysiske konstanter
Symbol Betydning Værdi
Σx 2 eller Σy
„ Statistik med én variabel / to variabler
Variabel Betydning
Xmin eller Ymin
„ Sandsynlighedsfordeling
„ Proceskapabilitet
LIMIT-SET , Distr . Vælg LIMIT-SET , og tryk på
„ Lineær regression
„ Talsystemkonverteringer
„ Rettelse af data
„ Negative udtryk
Reel værdi Imaginær værdi Absolut værdi Argumentværdi
Mode 4 Main
„ Grundlæggende aritmetiske operationer for talsystemerne
„ Logiske operationer
Основное руководство
Другие функции
Изменение координат
„ Функция автоматического отключения питания
Основное руководство
„ Источники питания
„ Замена Батареи
Индикатор Значение
„ Регулирование контраста
„ Отображение информации
Строка ввода
5QE
Перед началом вычислений
„ Изменение режима работы калькулятора
„ Выбор пунктов из меню дисплея
„ Функция повтора
„ Использование клавиш 2nd второго регистра
„ Курсор
„ Исправления при вводе информации
„ Запоминание вычислений
„ Технические характеристики
„ Порядок выполнения операций
Page
„ Появление ошибок
„ Формы индикации
„ Арифметические вычисления
„ Вычисления в скобках
„ Логарифмы и Антилогарифмы
„ Расчеты процентов
„ Функция непрерывных вычислений
„ Функция ответа
„ Тригонометрические и обратные тригонометрические функции
„ Обращение угловых единиц
„ Гиперболические и Обратные гиперболические функции
„ Перевод единиц
„ Изменение координат
„ Вероятность
„ Другие функции x-1, √, X , x
Символ Значение Величина
„ Физические постоянные
„ Выполнение процесса
„ Ввод данных для статистического анализа
Переменные Значение Cax или Cay
„ Вероятностное распределение
Cpx или Cpy
„ Корректировка данных
„ Линейная регрессия
„ Отрицательные выражения
„ Базовые преобразования
„ Базовые арифметические операции для оснований
„ Логические операции
Instrukcja Obsługi
Regresja liniowa Korygowanie danych
Prawdopodobięństwo Inne funkcje
Instrukcja Obsługi
„ Odczyt wyświetlacza
„ Używanie klawisza 2nd
Przed użyciem
„ Zmiana trybu
„ Wybieranie pozycji w menu
„ Funkcja powtarzania operacji
„ Dokonywanie korekt wprowadzonych danych
„ Funkcja wyszukiwania błędów
„ Kolejność operacji
„ Obliczenia wykorzystujące pamięć
„ Dokładność i pojemność
DMS DD, MM, SS.SS
„ Błędy
„ Formaty wyświetlania
„ Obliczenia arytmetyczne
„ Funkcja odpowiedzi
„ Obliczenia z użyciem nawiasów
„ Obliczenia procentów
„ Funkcja obliczeń ciągłych
„ Działania na ułamkach
„ Logarytmy i Antylogarytmy
„ Konwersja jednostek miar kątów
„ Funkcje hiperboliczne i odwrotne hiperboliczne
„ Funkcje trygonometryczne i odwrotne trygonometryczne
„ Transformacje współrzędnych
„ Konwersja jednostek
Symbol Znaczenie Wartość
„ Prawdopodobięństwo
„ Inne funkcje x-1, √, X , x
Mode 1 Stat
„ Testy istotności
„ Regresja liniowa
„ Rozkład prawdopodobieństwa
Zmienna Znaczenie
„ Konwersja układów liczbowych
„ Korygowanie danych
„ Operacje logiczne
„ Wartości ujemne
Mode 5 QE
Petunjuk Umum
Konstanta Fisika
Mode 2 Base-n
Mode 3 Cplx
Probabilitas Fungsi-fungsi Lainnya
„ Menghidupkan dan Mematikan
„ Fungsi Auto Power-Off
„ Operasi Reset
Petunjuk Umum
„ Pembacaan Tampilan Layar
„ Penyetelan Kontras Layar
Indikator Arti
„ Menggunakan Tombol 2nd
„ Mengubah mode
Sebelum mulai menghitung
„ Memilih sebuah item dari menu yang ditampilkan
„ Fungsi Replay
„ Melakukan koreksi selama meng-input data
„ Fungsi Tampilan Posisi Kesalahan
„ Urutan Operasi
„ Perhitungan dengan Memori
„ Akurasi dan Kapasitas
FREQ. = n, 0 ≤ n 10 100 n bilangan bulat
Overflow Er
„ Kondisi Kesalahan
„ Format tampilan di layar
„ Perhitungan Aritmetika
„ Fungsi Jawaban
„ Perhitungan dengan Tanda Kurung
„ Perhitungan Persentase
„ Fungsi perhitungan kontinu
„ Perhitungan Pecahan
„ Logaritma dan Antilogaritma
„ Konversi Unit Sudut
„ Fungsi Hiperbolik / Hiperbolik-Balik
„ Fungsi Trigonometrik / Trigonometrik-Balik
„ Transformasi Koordinat
„ Konstanta Fisika
„ Probabilitas
„ Fungsi-fungsi Lainnya x-1, √, X , x
„ Konversi Unit
„ Statistika Variabel Tunggal / Ganda
„ Kapabilitas Proses
„ Regresi linear
„ Sebaran probabilitas
Variabel Arti
„ Konversi basis
„ Mengoreksi data
Bilangan real Nilai imajiner Absolute value Nilai argumen
„ Ekspresi Negatif
„ Operasi aritmetika dasar untuk basis
„ Operasi logika
Mode 5 QE
使用前說明
單變數統計/ 雙變數統計 製程能力 或然率分配 線性回歸 修正數據
單位換算 物理常數
進位間的轉換 進位間的算數計算 邏輯計算
一般操作說明
Base-n 進位狀態啟動
Main 主狀態啟動
Degrad 角度模式:度DEG, 徑度GRAD, 弧度RAD Engsci 工程式ENG 科學式 SCI 標記法
5QE 。
使用前說明
„ 錯誤位置顯示功能
„ 容量與精確度
但對 tan θ而言:
Overflow Er Stat Er
„ 錯誤
„ 算術計算
操作模式 0 Main
„ 連續計算功能
„ 角單位換算
„ 或然率
Sx 或 Sy
操作模式 1 Stat
Xmax 或 Ymax
Xmin 或 Ymin
DATA-INPUT,LIMIT-SET,DISTR。請選擇 Distr 並按 。
Σx 或 σy
Σx 2 或 Σy
Cax 或 Cay
„ 線性回歸
操作模式 3 Cplx
操作模式 2 Base-n
Re 實數值 Im 虛數值
操作模式 5 QE
操作模式 4 VLE
Ab 絕對值 Ar 輻角值
Weee Mark
EU Batt 140x75mm
HDBSR285T19