NX3500 specifications
The Dell NX series, including the NX3610, NX3600, and NX3500, represents a robust and efficient solution for organizations seeking to optimize their storage solutions. These storage appliances are designed to meet the growing needs of data-driven businesses, providing a comprehensive platform that integrates software and hardware for optimal performance.The Dell NX3610 is a high-performance storage solution that boasts an advanced dual-controller architecture. This model supports enhanced scalability and redundancy, ensuring that organizations can handle increasing data loads effortlessly. It is built for faster data access with a range of connectivity options, including 10GbE and iSCSI, enabling seamless integration into diverse IT environments. The NX3610 supports advanced file sharing capabilities, making it ideal for businesses requiring efficient collaboration and data access across multiple platforms. Furthermore, with features like snapshot and replication, users can ensure data integrity and security, minimizing downtime in case of system failures.
The NX3600, while slightly smaller in capacity compared to the NX3610, still delivers formidable performance and flexibility. It is designed to cater to mid-sized businesses that need a reliable and cost-effective storage solution. The NX3600 features a single-controller architecture, making it easier to manage and deploy in smaller IT environments. It offers support for various storage protocols, including NFS and CIFS, which are essential for organizations looking to support diverse application workloads. Its easy-to-use management interface makes it simple for IT teams to monitor and configure settings, ensuring optimal performance with minimal effort.
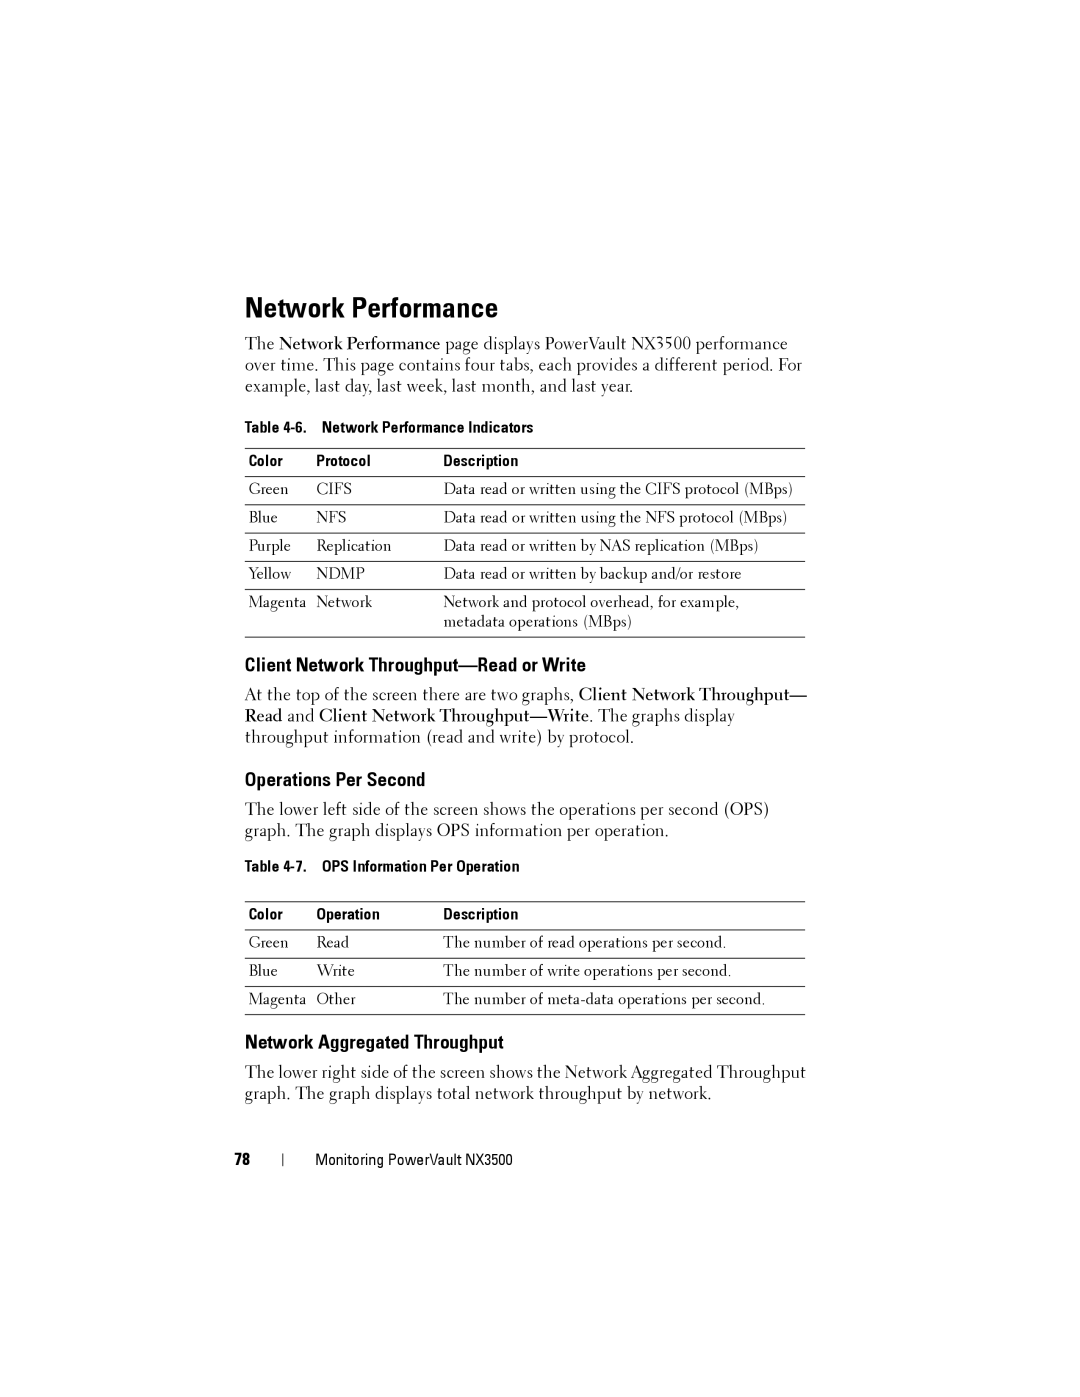
The NX3500 serves as an entry-level model within the NX series, specifically targeted at small to medium-sized businesses. It combines affordability with essential features needed for efficient data storage and sharing. The NX3500 is equipped with a user-friendly interface and includes support for both file-based and block-based storage, offering flexibility for diverse workloads. Moreover, the appliance features integrated backup solutions, which are crucial for ensuring data safety and compliance. Users will also appreciate its robust data deduplication and compression capabilities that significantly reduce storage costs by minimizing the amount of data stored.
In summary, the Dell NX3610, NX3600, and NX3500 are engineered to cater to various business sizes and storage demands. With their sophisticated technologies, including dual-controller systems, rich protocol support, and user-friendly management features, these appliances deliver reliable, scalable, and efficient storage solutions for any organization looking to enhance its data management capabilities.
