MCE windows and dialogs | MCE User’s Guide |
The amplitude window shows the activity of the selected ROI (p. 14) during the whole response. You can also use it to select a time point or time range (p. 13).
To select a time point, use the left mouse button. To select a time range, drag with the right mouse button.
The text box shows the selected ROI, time range and the average amplitude during the time range.
You can change the X- and
The [Option] menu includes the button [Show predicted fields], which shows the measured and predicted MEG waveforms with the XPlotter program (p. 16).
12.10 Amplitude scale window
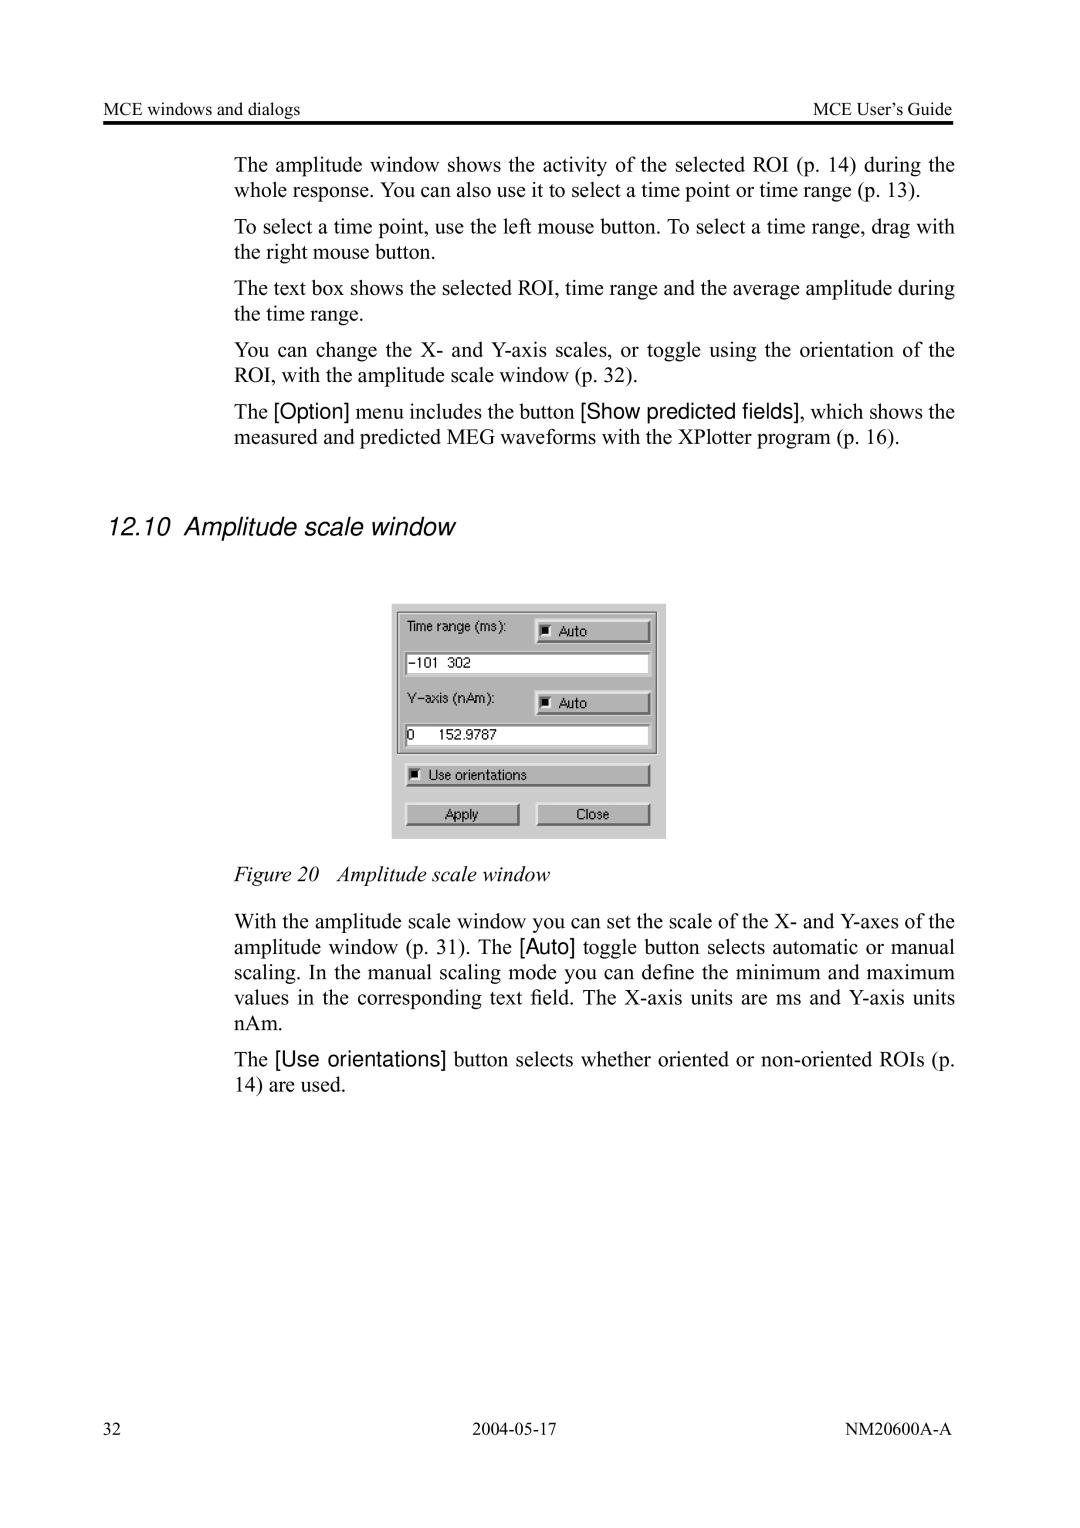
Figure 20 Amplitude scale window
With the amplitude scale window you can set the scale of the X- and
The [Use orientations] button selects whether oriented or
32 |
