Predicting MEG waveforms | MCE User’s Guide |
9 Predicting MEG waveforms
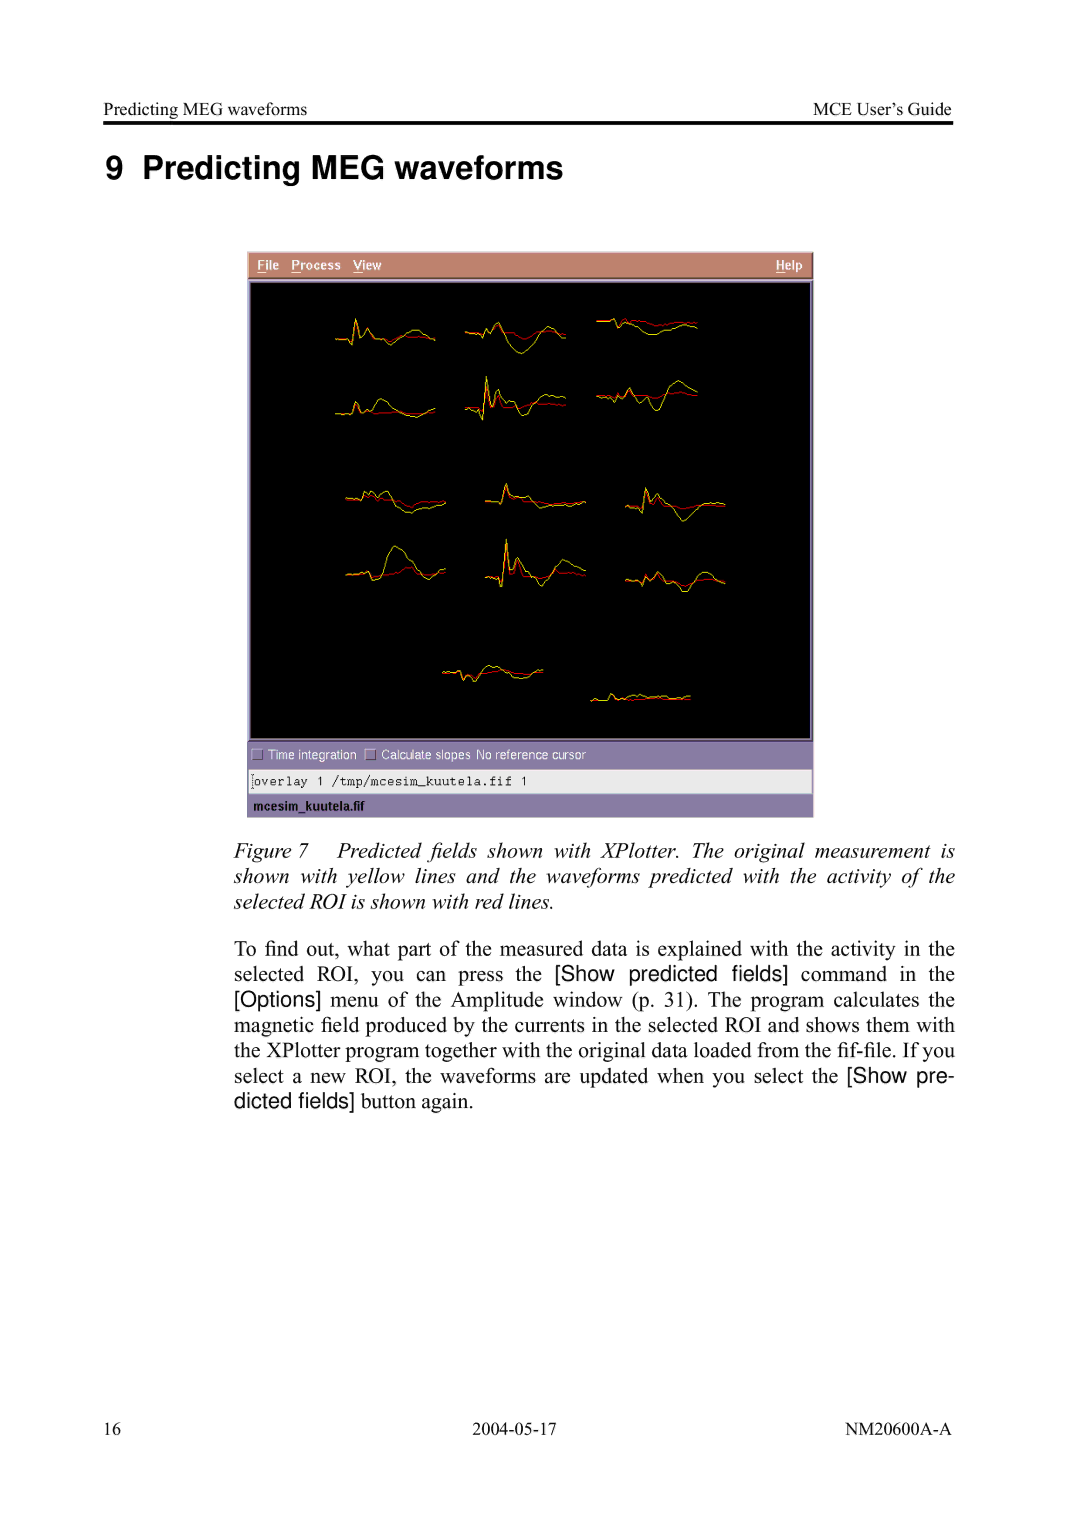
Figure 7 Predicted fields shown with XPlotter. The original measurement is shown with yellow lines and the waveforms predicted with the activity of the selected ROI is shown with red lines.
To find out, what part of the measured data is explained with the activity in the selected ROI, you can press the [Show predicted fields]command in the [Options] menu of the Amplitude window (p. 31). The program calculates the magnetic field produced by the currents in the selected ROI and shows them with the XPlotter program together with the original data loaded from the
16 |