Trail brilliance
Trail brilliance may be adjusted on the BRILL menu.
1)Press the MENU key.
2)Select the BRILL menu.
3)Press the ENTER/SELECT key.
4)Select TRAIL and press the ENTER/SELECT key.
5)Operate the VRM or EBL control to adjust trail brilliance.
6)Press the ENTER/SELECT key.
7)Press the MENU key.
1.27 Electronic Plotting (E-plot)
10
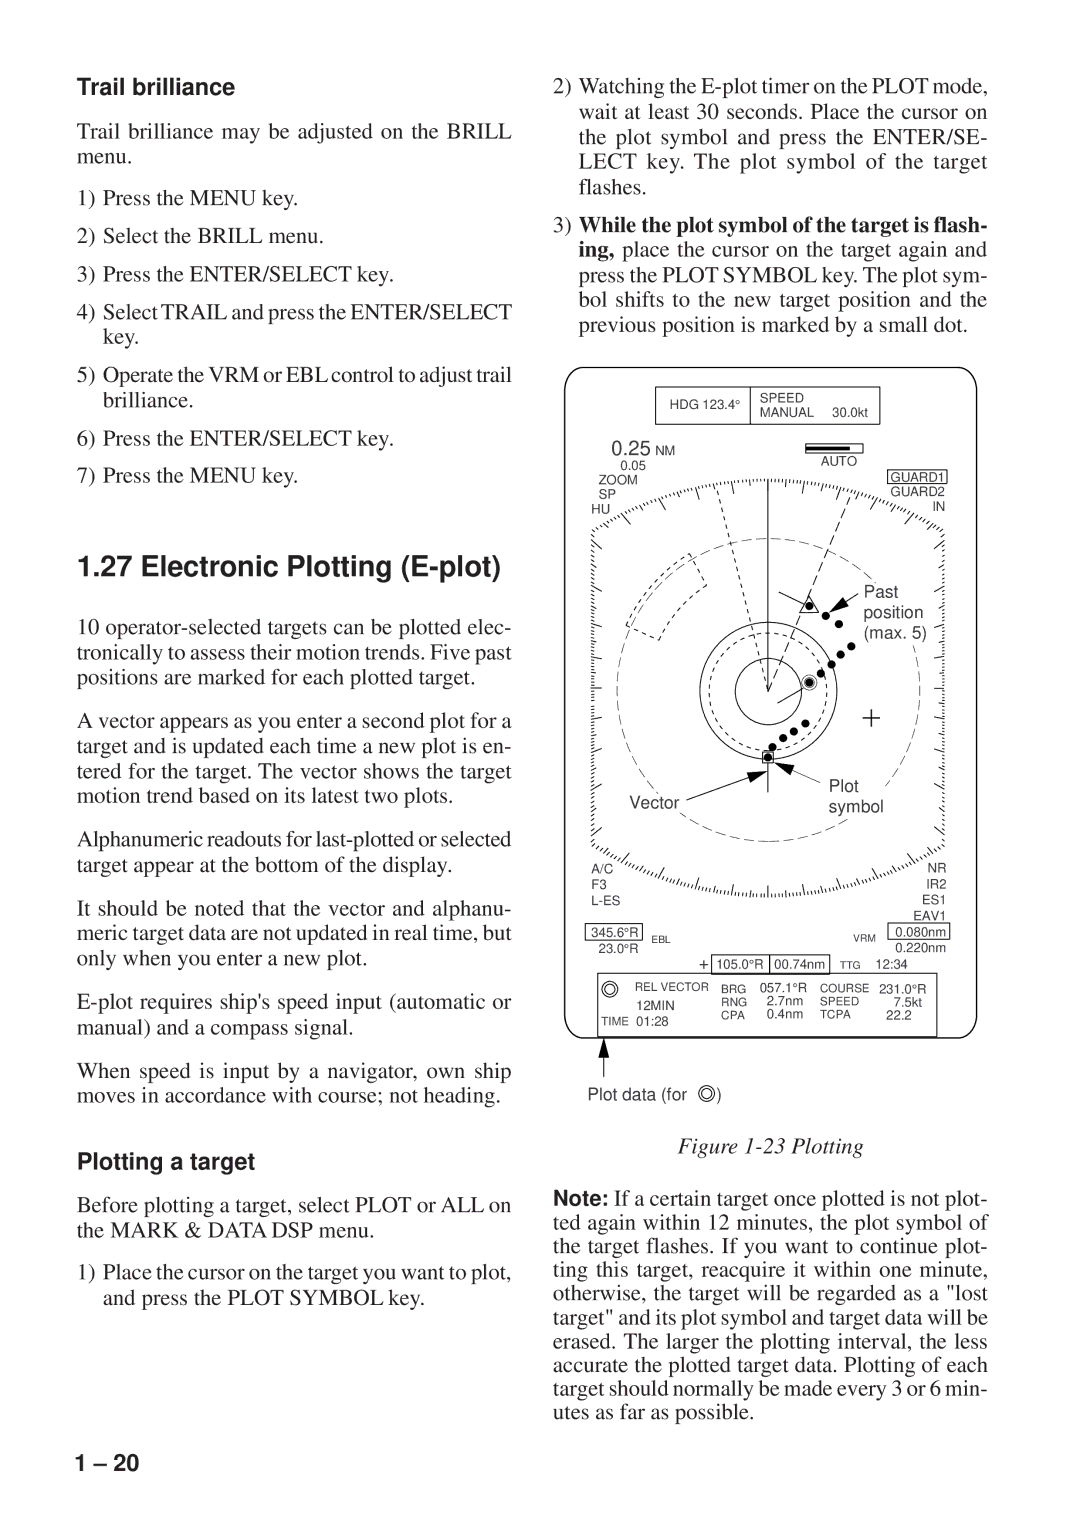
A vector appears as you enter a second plot for a target and is updated each time a new plot is en- tered for the target. The vector shows the target motion trend based on its latest two plots.
Alphanumeric readouts for
It should be noted that the vector and alphanu- meric target data are not updated in real time, but only when you enter a new plot.
When speed is input by a navigator, own ship moves in accordance with course; not heading.
Plotting a target
Before plotting a target, select PLOT or ALL on the MARK & DATA DSP menu.
1)Place the cursor on the target you want to plot, and press the PLOT SYMBOL key.
2)Watching the
3)While the plot symbol of the target is flash- ing, place the cursor on the target again and press the PLOT SYMBOL key. The plot sym- bol shifts to the new target position and the previous position is marked by a small dot.
|
|
| SPEED |
| HDG 123.4° |
| |
|
| MANUAL 30.0kt | |
|
|
| |
|
|
|
|
0.25 NM
0.05 | AUTO | |
GUARD1 | ||
ZOOM | ||
SP | GUARD2 | |
HU | IN |
 Past
Past
position (max. 5)
Vector | Plot |
| ||
symbol |
| |||
A/C |
|
| NR | |
F3 |
|
| IR2 | |
|
| ES1 | ||
|
|
| EAV1 | |
345.6°R | EBL | VRM | 0.080nm | |
23.0°R | 0.220nm | |||
|
| |||
+105.0°R 00.74nm TTG 12:34
REL VECTOR | BRG | 057.1°R | COURSE | 231.0°R |
12MIN | RNG | 2.7nm | SPEED | 7.5kt |
TIME 01:28 | CPA | 0.4nm | TCPA | 22.2 |
|
|
|
|
Plot data (for | ) |
Figure 1-23 Plotting
Note: If a certain target once plotted is not plot- ted again within 12 minutes, the plot symbol of the target flashes. If you want to continue plot- ting this target, reacquire it within one minute, otherwise, the target will be regarded as a "lost target" and its plot symbol and target data will be erased. The larger the plotting interval, the less accurate the plotted target data. Plotting of each target should normally be made every 3 or 6 min- utes as far as possible.
1 – 20
