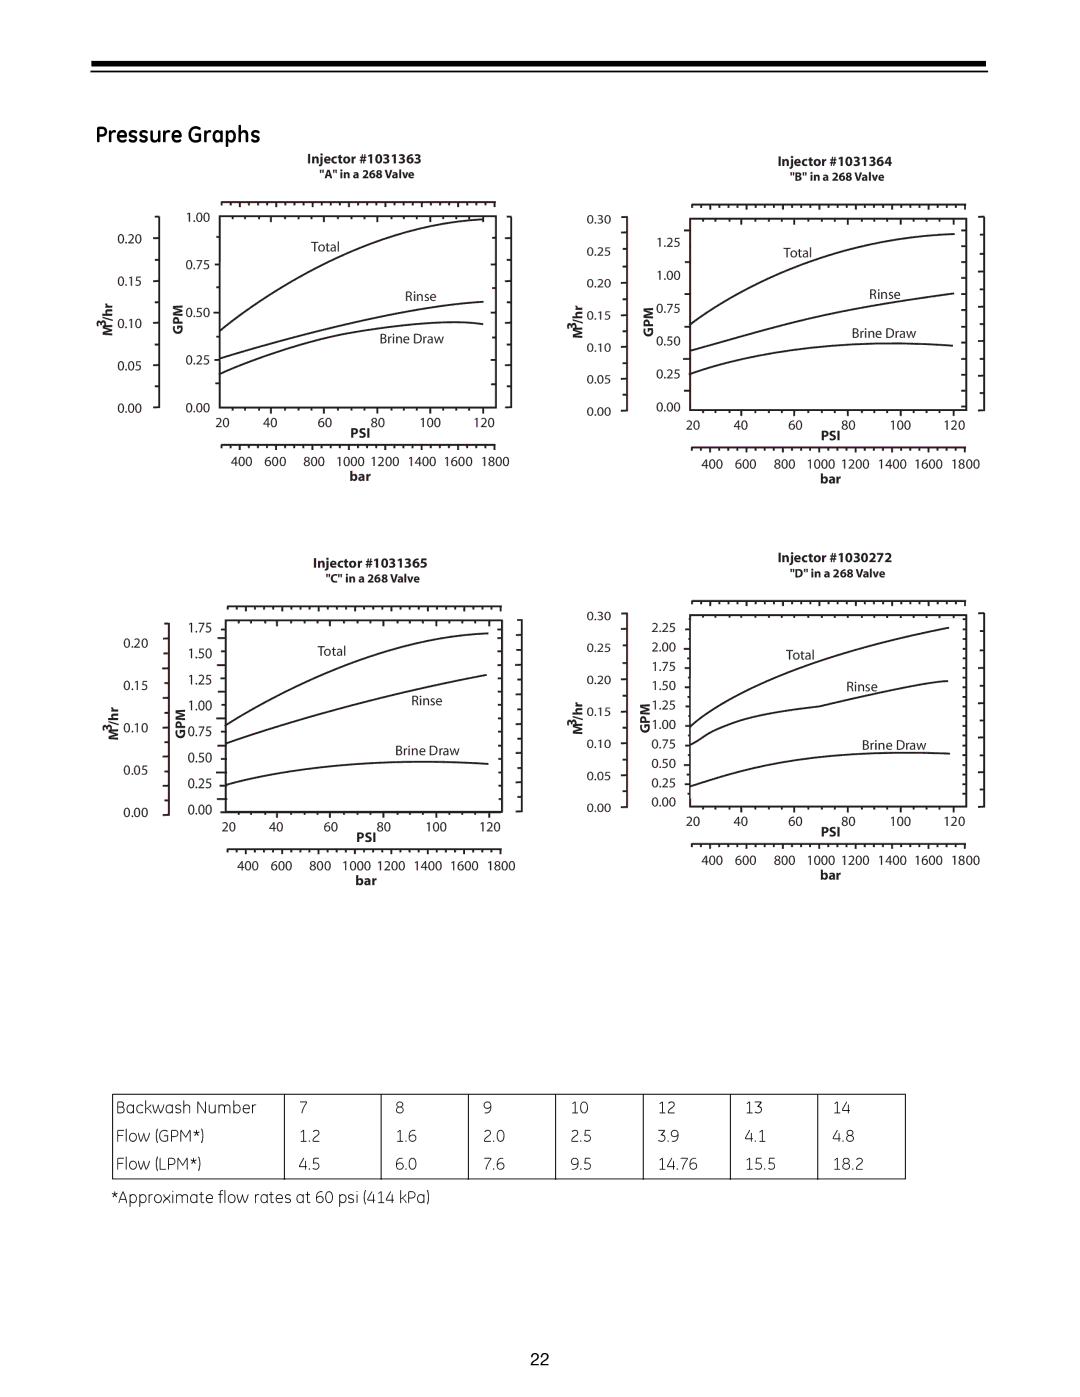
Pressure Graphs
Injector #1031363
|
|
| "A" in a 268 Valve |
|
|
| 1.00 |
| 0.20 |
| Total |
|
|
| |
|
|
| 0.75 |
| 0.15 |
| Rinse |
/hr |
| GPM | |
0.10 | 0.50 | ||
M |
| ||
3 |
|
|
|
Brine Draw
0.050.25
0.000.00
20 | 40 | 60 | 80 | 100 | 120 |
|
|
| PSI |
|
|
400 600 800 1000 1200 1400 1600 1800 bar
Injector #1031365
"C" in a 268 Valve
1.75 |
|
0.20 | Total |
1.50 |
0.151.25
/hr |
| 1.00 |
| Rinse |
|
|
| ||
0.10 | GPM0.75 |
|
| |
|
| |||
M |
|
| ||
3 |
|
|
|
|
|
|
|
|
|
|
| 0.50 |
| Brine Draw |
| 0.05 |
|
| |
|
|
|
| |
|
|
|
|
0.25
0.000.00
20 40 60 80 100 120
PSI
400 600 800 1000 1200 1400 1600 1800 bar
M3/hr
M3/hr
0.30
0.25 |
| 1.25 |
|
| |
0.20 |
| 1.00 |
|
| |
0.15 | GPM | 0.75 |
| ||
|
|
0.10 | 0.50 |
|
0.050.25
0.000.00
0.30
2.25
0.252.00
1.75
0.201.50
| 1.25 |
0.15 | GPM1.00 |
|
0.100.75
0.50
0.050.25
0.00 0.00
Injector #1031364
"B" in a 268 Valve
Total
Rinse
Brine Draw
20 | 40 | 60 | 80 | 100 | 120 | |||||||||||
|
|
|
|
|
|
|
|
| PSI |
|
|
|
|
|
| |
400 600 800 1000 1200 1400 1600 1800 bar
Injector #1030272
"D" in a 268 Valve
Total
|
|
|
|
| Rinse |
| |
|
|
|
|
|
|
|
|
|
|
|
|
|
|
|
|
|
|
|
|
|
|
|
|
|
|
|
|
|
|
|
|
|
|
|
|
|
| Brine Draw |
|
|
|
|
|
|
|
|
|
|
|
|
|
|
|
|
|
|
|
|
|
|
|
|
|
|
|
|
|
|
|
|
|
| 20 | 40 | 60 | 80 | 100 | 120 | |
|
|
|
|
| PSI |
|
|
400 600 800 1000 1200 1400 1600 1800 bar
Backwash Number | 7 | 8 | 9 | 10 | 12 | 13 | 14 |
Flow (GPM*) | 1.2 | 1.6 | 2.0 | 2.5 | 3.9 | 4.1 | 4.8 |
Flow (LPM*) | 4.5 | 6.0 | 7.6 | 9.5 | 14.76 | 15.5 | 18.2 |
|
|
|
|
|
|
|
|
*Approximate flow rates at 60 psi (414 kPa)
22