HP Hub & Switch Management for OV-UX
User Guide
Publication Number
Contents
Alerts Find/Fix/Inform
Setting Up Security for a Device
HP Hub & Switch Management Admin
Information About HP Hub & Switch Management for OV-UX
Introduction
Features of HP Hub & Switch Management
HP Proactive Networking
Control
Uptime
Support for New Switches
Several new switches are supported, as described below
Technical Product Support
Technical Product Support
Before Installing HP Hub & Switch Management for OV-UX
Support Information
Management Station Requirements
Hardware
Software
Hub For OV
Required Network Configuration
Required Network Configuration
Before Installing HP Hub & Switch Management
Required Patches
Required Patches
Removing HP Hub & Switch Management
Installation Directories
Removing HP Hub & Switch Management
Management products
Introduction to HP Hub & Switch Management
HP Hub & Switch Management Overview
HP OpenView Network Management Platform
Definitions, Processes, and Files
HP OpenView Network Management Platform
Snmp Manager and Agents
Definitions, Processes, and Files
What HP Devices Can Be Managed
HP Devices That Can be Managed
What HP Devices Can Be Managed
HP J2410A AdvanceStack 100 VG Hub-15Note
HP J3202A AdvanceStack 10Base-T Switching Hub-24RNote
HP J3204A AdvanceStack 10Base-T Switching Hub-24TNote
HP J3245A AdvanceStack Switch 800T
HP J3298A HP Procurve Switch 212M
Snmp Configuration and Snmp MIB Browser
Running HP Hub & Switch Management
Starting the Manager Application
Starting HP OpenView
Starting the Manager Application
Display
Verifying Installation of the Manager Product Set
Verifying Installation of the Manager Product Set
Monitor HP Hub/Switch
Addressed HP hub, bridge, or switch
Stopping and Restarting the Manager Application
Stopping the Manager
Stopping and Restarting the Manager Application
Use the command /opt/OV/bin/ovstart
Restarting the Manager
Management
Alerts Find/Fix/Inform
HP Proactive Networking
Control
Alerts Find/Fix/Inform
Uptime
Performance
Interpreting the Alert Log Find/Fix/ Inform
Interpreting the Alert Log Find/Fix/Inform
Find/Fix/Inform Faults
Alerts Find/Fix/Inform
Log for first time installation information for the device
Accessing Hub Features
More Information on Device Features
Accessing FHub eatures
More Information on Device Features
Accessing the Device View
Accessing Hub Features
Accessing the Device View
Viewing Device Identity Information
Reading the Performance Gauges
Interpreting Device Status
Switching Hub Global Counters
Switching Hub Global Counters
Status Global Counters
Hub Global Counters
Configuring Your Device
Status Port Counters
Configuration Fault Detection
Base-T Hub-12M Device View
Configuration System Information
Fault Detection Sensitivity Settings
Configuring IP
Hub IP Configuration
Switching Hub IP Configuration
Port Configuration
Configuration Backup Links
Hub Port Configuration
Or no violation
Backup Link Parameters
Configuring Load Balancing Switching Hubs
Configuration Support URL
Before the backup port becomes active
Retries
Accessing Hub Features
Managing Switches
Switch Status
Managing Switches
Switch Status
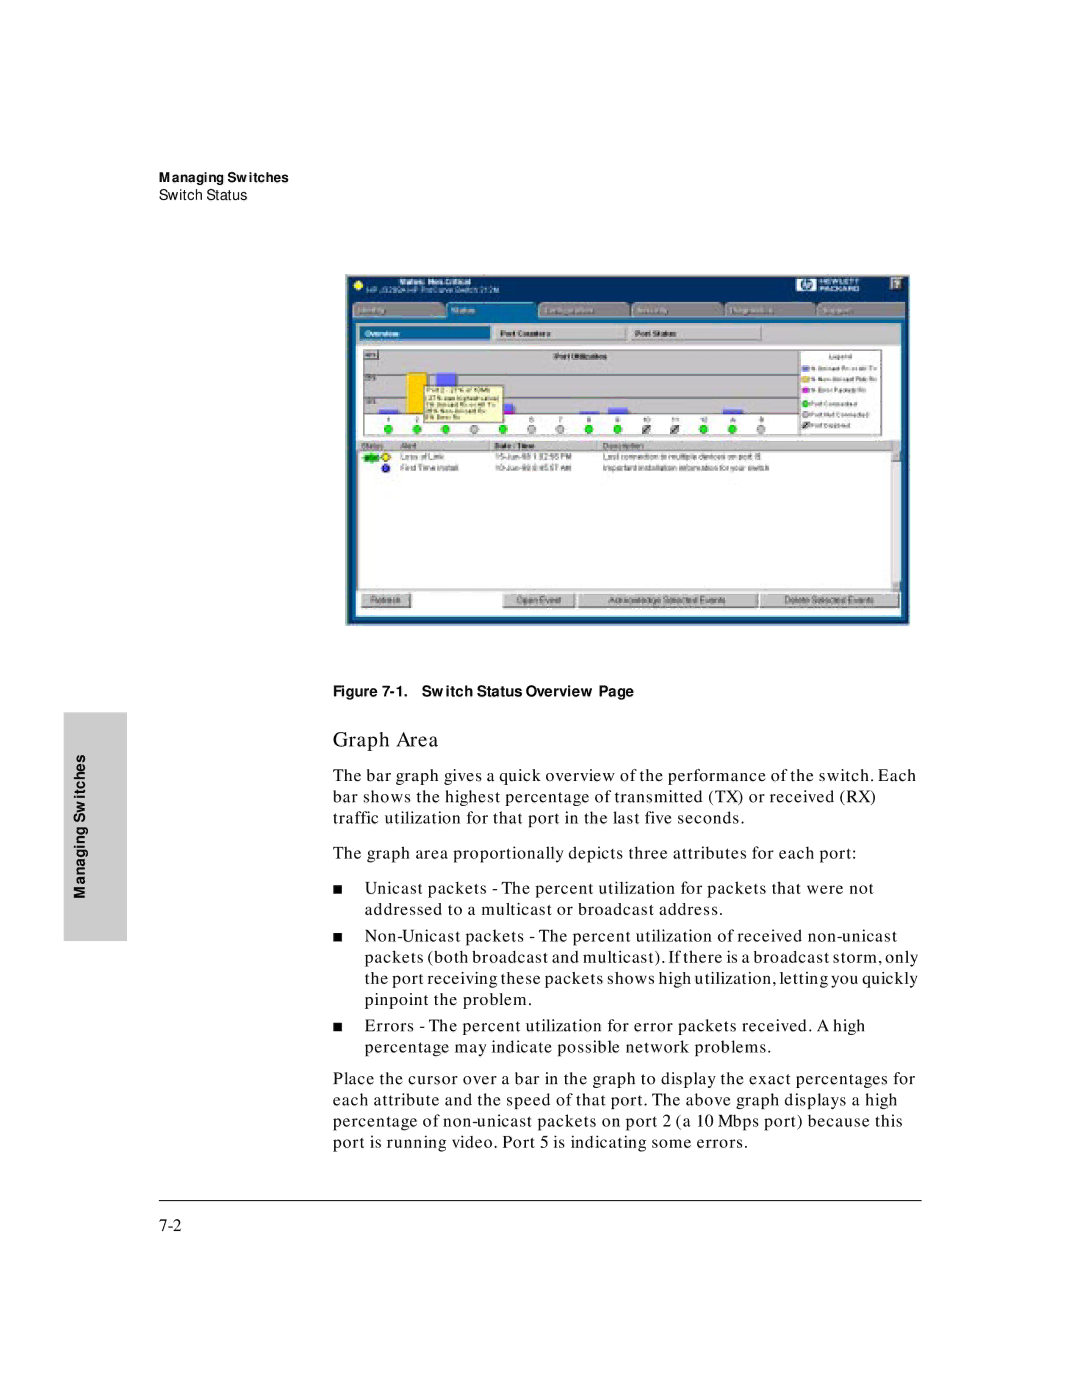
Switch Status Overview
Graph Area
Alert Log Area Find/Fix/Inform
Description
Port Status Settings
Status Port Status
Configuration
Identity
Device View
Identity
HP ProCurve Switch 8000M Device View
Configuration
Configuration IP Configuration
Switch IP Configuration
Configuration Port Configuration
With the device on that port to determine the mode
Click on Modify Selected Ports to change the mode
Following
Trkx The port trunk to which this port belongs
Configuration Assigning a Monitoring Port
Flow Control
Drops any flow control packets it receives
10/100TX, 10FL, 100FX
Using Vlans
Selecting a Monitoring Port on a Switch
Configuration Device Features
Automatic Broadcast Control ABC
Automatic IP Gateway Configuration
Enabling Broadcast Control for IP
Enabling Broadcast Control for IPX
Internet Group Management Protocol Igmp
Spanning Tree Protocol
Forward with High Priority
Configuration Support/Mgmt URLs
Support URL
Management Server URL
Managing Switches
Setting Up Security for a Device
Device Passwords
Setting Up Security for a Device
Device Passwords
Manager/Operator Password Combinations
Up Security for a Device
Manager/Operator Password Combinations
Setting Up Security Device
Function of Community Names
Port Security hubs only
Address Selection
Address Selection
Port Security hubs only
Send Alarm
Authorized Address
Eavesdrop Prevention
Disable Port
Set Trap Receiver Thresholds
Set Security Policy for Selected Ports hubs only
Intrusion Log hubs only
Set Security Policy for Selected Ports hubs only
Intrusion Log hubs only
Performing Diagnostics
Performing Diagnostics
Performing a Ping/Link Test
Performing a Ping/Link Test
Rebooting a Device
Rebooting a Device
Resetting a Hub to Factory Default Settings
Producing a Configuration Report
Resetting a Hub to Factory Default Settings
Producing a Configuration Report
HP Hub & Switch Management Admin
Starting HP Hub & Switch Management Admin
HP Admin Parameters
HP OpenView Device Symbols
HP Hub & Switch
Network Parameters
User Interface Parameters
User Interface Parameters
Graph Options Parameters
Graph Option Parameters
Printer Configuration Parameters
Management Admin HP Hub & Switch
OpenView Configuration Options
Set As Default
Installed Printers list
Printer
OpenView Configuration Options
Opt/netscape/netscape
10-14
Management for Non-Browserable Devices
About Closeup Views
Displaying the Closeup View
For Non Devices
About Closeup Views
Closeup View Areas
Title Bar
Message Bar
Toolbar
Overview of Toolbar Functions
Hub LAN Ports
Summary of Toolbar Functions
Hubs gauges for LAN Activity, Error Packets
Switches gauges for LAN Activity, Packets
Hub, 100VG hub, 10/100 switch, or bridge
Configuration Displays a tabbed dialog box for device
Enable Port Enables a selected hub port. If a password is
Disable Port
Displays the Vlan Configuration window
Diagnose
Enabled/Disabled status
Status the port is enabled or disabled
Properties
Change information about a selected Vlan or
Configuration Functions
Setting the Configuration Parameters
Appendix a
Agent Firmware Versions
Verifying Device Agent Versions
AAppendix
Preparing Network Devices
Device Network Addresses
Appendix a
Preparing Network Devices
Configuring IP Parameters
Globally Assigned IP Network Addresses
Appendix a
Network Bootp Server
Appendix a
Index
Index
Hosts.equiv … 10-13 HP Admin …
Packets … 6-5 queriers … 7-14 traffic …
Select All Ports … 6-6 Send Alarm … 8-5 sensitivity … 6-7

