The SVA serves as a key unit in an integrated computing environment that displays the results of generated data in locations where scientists and engineers can most effectively carry out analyses individually or collaboratively.
SVA Clusters
This section gives a
The SVA
HP SVA offers a graphics visualization solution that can be used by a variety of applications that run on distributed computing systems; in this case, a cluster of Linux workstations. Figure
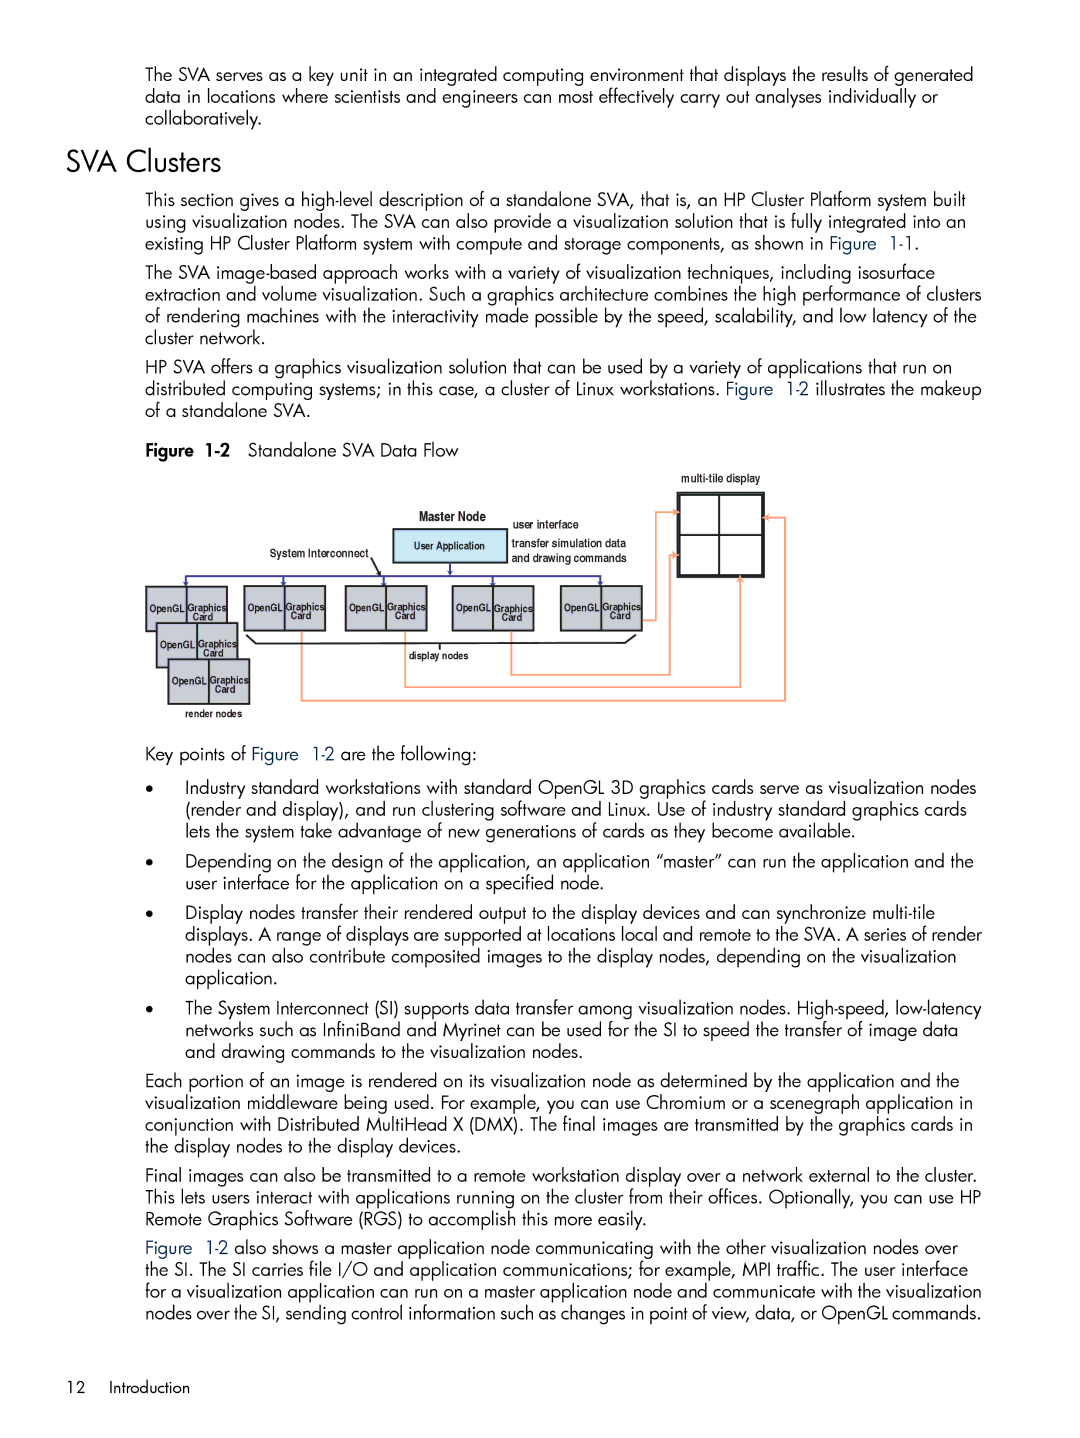
Figure 1-2 Standalone SVA Data Flow
|
|
| Master Node | user interface | ||
|
|
|
|
| ||
| System Interconnect | User Application | transfer simulation data | |||
|
|
| and drawing commands | |||
|
|
|
|
| ||
OpenGL Graphics | OpenGL Graphics | OpenGL Graphics | OpenGL Graphics | OpenGL Graphics | ||
Card | Card |
| Card |
| Card | Card |
OpenGL Graphics |
|
|
|
|
|
|
Card |
|
| display nodes |
|
| |
OpenGL Graphics |
|
|
|
|
| |
Card |
|
|
|
|
|
|
render nodes |
|
|
|
|
|
|
Key points of Figure
•Industry standard workstations with standard OpenGL 3D graphics cards serve as visualization nodes (render and display), and run clustering software and Linux. Use of industry standard graphics cards lets the system take advantage of new generations of cards as they become available.
•Depending on the design of the application, an application “master” can run the application and the user interface for the application on a specified node.
•Display nodes transfer their rendered output to the display devices and can synchronize
•The System Interconnect (SI) supports data transfer among visualization nodes.
Each portion of an image is rendered on its visualization node as determined by the application and the visualization middleware being used. For example, you can use Chromium or a scenegraph application in conjunction with Distributed MultiHead X (DMX). The final images are transmitted by the graphics cards in the display nodes to the display devices.
Final images can also be transmitted to a remote workstation display over a network external to the cluster. This lets users interact with applications running on the cluster from their offices. Optionally, you can use HP Remote Graphics Software (RGS) to accomplish this more easily.