37LT670H, 26LT670H, 42LT670H, 55LS675H, 32LT670H specifications
LG Electronics has long been a leader in the television market, and its LT670H series exemplifies the company's commitment to innovation and quality. This series includes models in various sizes: 42LT670H, 26LT670H, 32LT670H, and 37LT670H, catering to different consumer preferences and space requirements.One of the hallmark features of the LT670H series is its high-definition display. All models in this lineup support resolutions that deliver sharp and vibrant images, ensuring a superior viewing experience. With their sleek and modern design, these televisions not only perform well but also enhance the aesthetics of any room.
LG's commitment to technology is evident in the incorporation of their renowned Triple XD Engine. This advanced picture processing technology enhances color accuracy, sharpness, and contrast, resulting in lifelike images. Whether users are watching movies, playing video games, or viewing sports, the LT670H series promises an immersive experience with stunning visuals.
The series is equipped with built-in speakers that provide clear and powerful audio. Additionally, the televisions are designed to work seamlessly with LG’s Clear Voice technology, which enhances dialogue clarity amid background sounds. This feature ensures that viewers never miss a word, making the LT670H series ideal for watching dramas, sports, or even news broadcasts.
Connectivity is also a strong point for the LT670H series. These models come with multiple HDMI and USB ports, which allow users to easily connect various devices such as gaming consoles, streaming devices, or external hard drives. The inclusion of support for various audio and video formats further adds to the versatility of these televisions.
For gamers, the LT670H series offers low input lag, making it a suitable choice for fast-paced gaming. Features like Game Mode optimize settings for gaming, ensuring a fast and responsive experience.
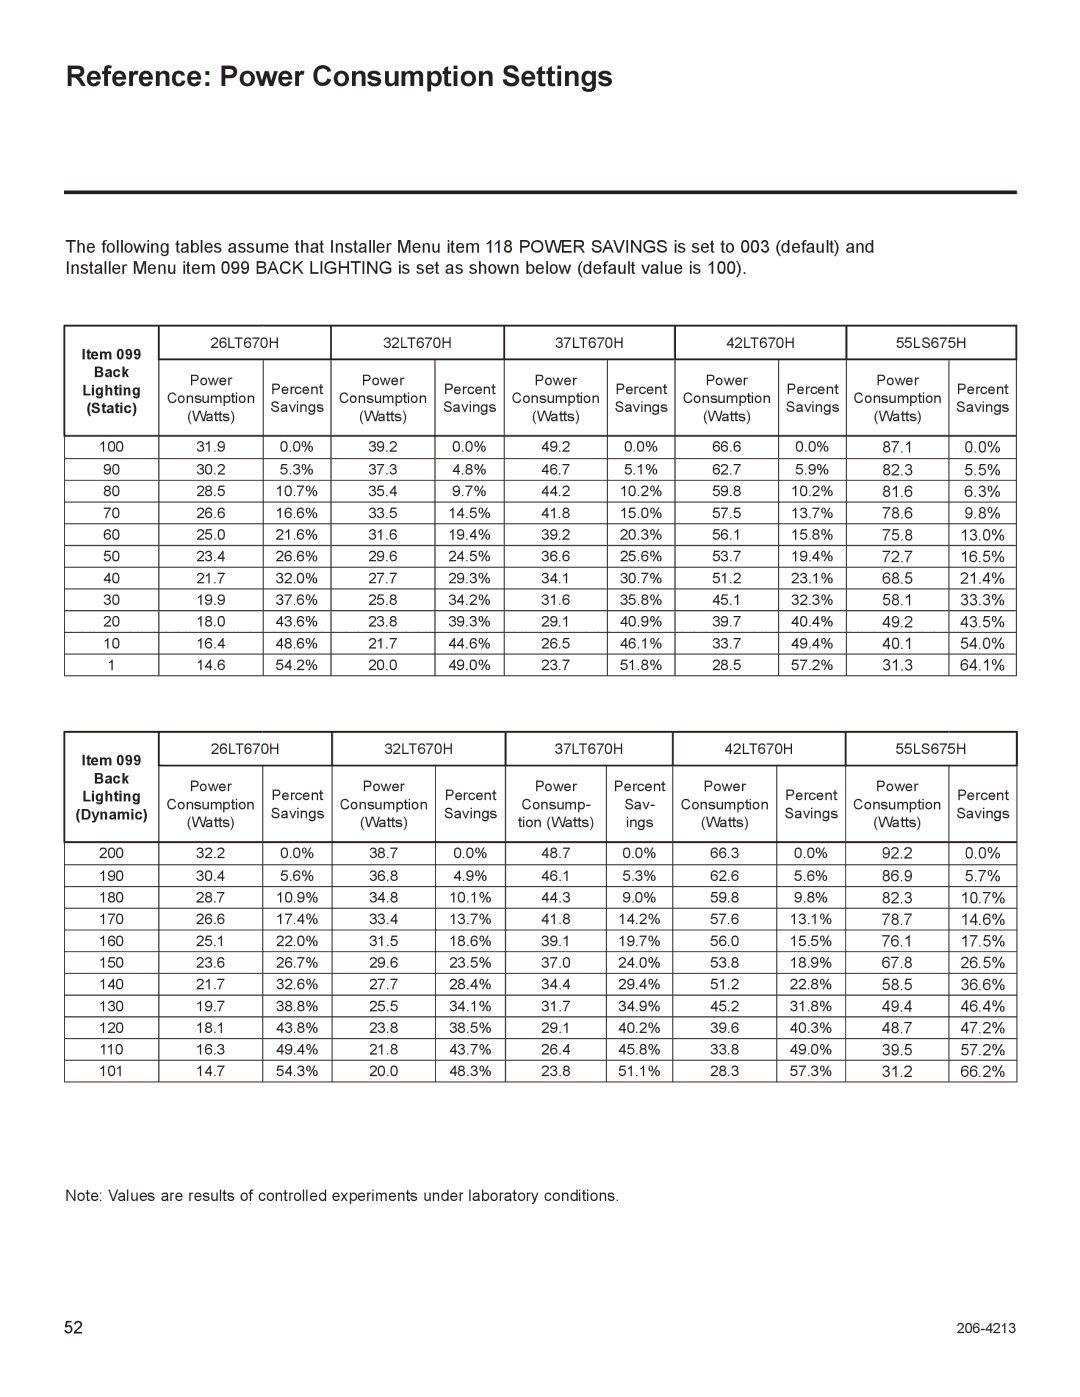
Moreover, LG has implemented energy-saving technologies across the LT670H range, demonstrating their commitment to sustainability. The energy-efficient designs help in reducing electricity consumption without compromising performance.
In summary, the LG Electronics LT670H series, including the 42LT670H, 26LT670H, 32LT670H, and 37LT670H models, combines cutting-edge technology, superior sound quality, and comprehensive connectivity options. These features make the LT670H series an excellent choice for consumers looking for high-quality televisions that fit various room sizes and viewing preferences. With their blend of performance and aesthetic appeal, the LT670H models stand out in today’s competitive television market.