Omron Healthcare IM-HMS-HEM-SOFT-IT2-A-06-11/2011 manual Blood Pressure Data Management Screen

Models: IM-HMS-HEM-SOFT-IT2-A-06-11/2011

1 30
Download 30 pages 53.82 Kb
Page 14
Image 14

Blood Pressure Data Management Screen

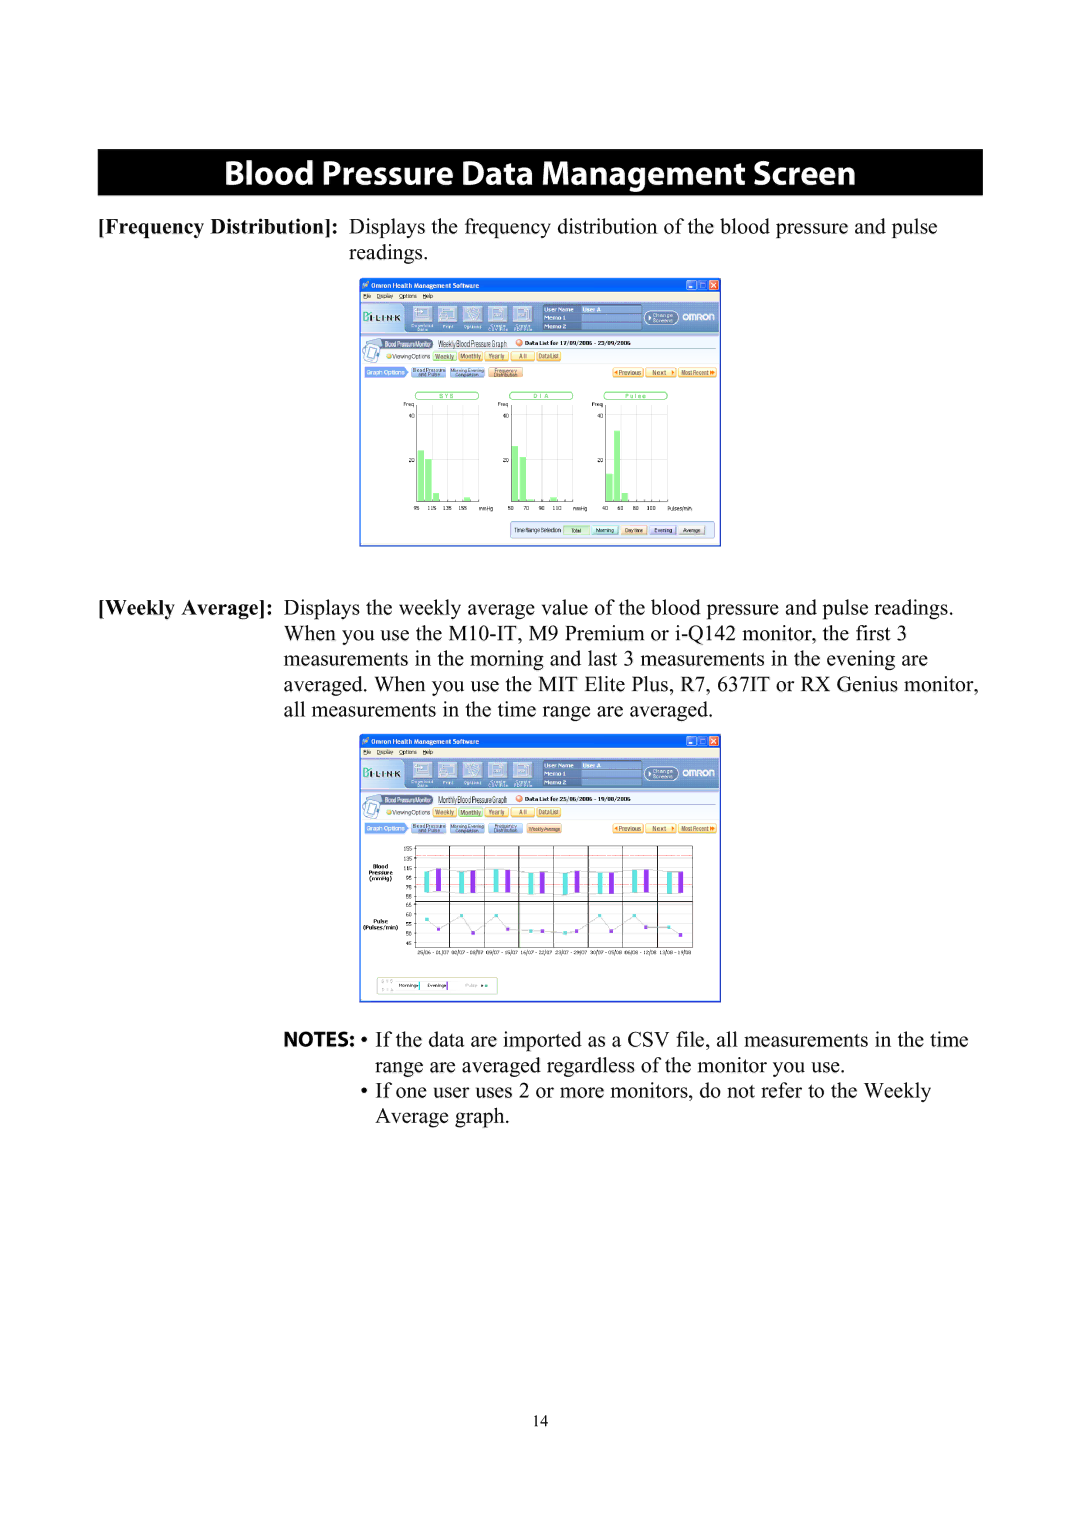
[Frequency Distribution]: Displays the frequency distribution of the blood pressure and pulse readings.

[Weekly Average]: Displays the weekly average value of the blood pressure and pulse readings. When you use the M10-IT, M9 Premium or i-Q142 monitor, the first 3 measurements in the morning and last 3 measurements in the evening are averaged. When you use the MIT Elite Plus, R7, 637IT or RX Genius monitor, all measurements in the time range are averaged.

NOTES: • If the data are imported as a CSV file, all measurements in the time range are averaged regardless of the monitor you use.

If one user uses 2 or more monitors, do not refer to the Weekly Average graph.

14

Page 14
Image 14
Omron Healthcare IM-HMS-HEM-SOFT-IT2-A-06-11/2011 manual Blood Pressure Data Management Screen