ARM720T_LH79520 – Sharp LH79520 SoC with ARM720T
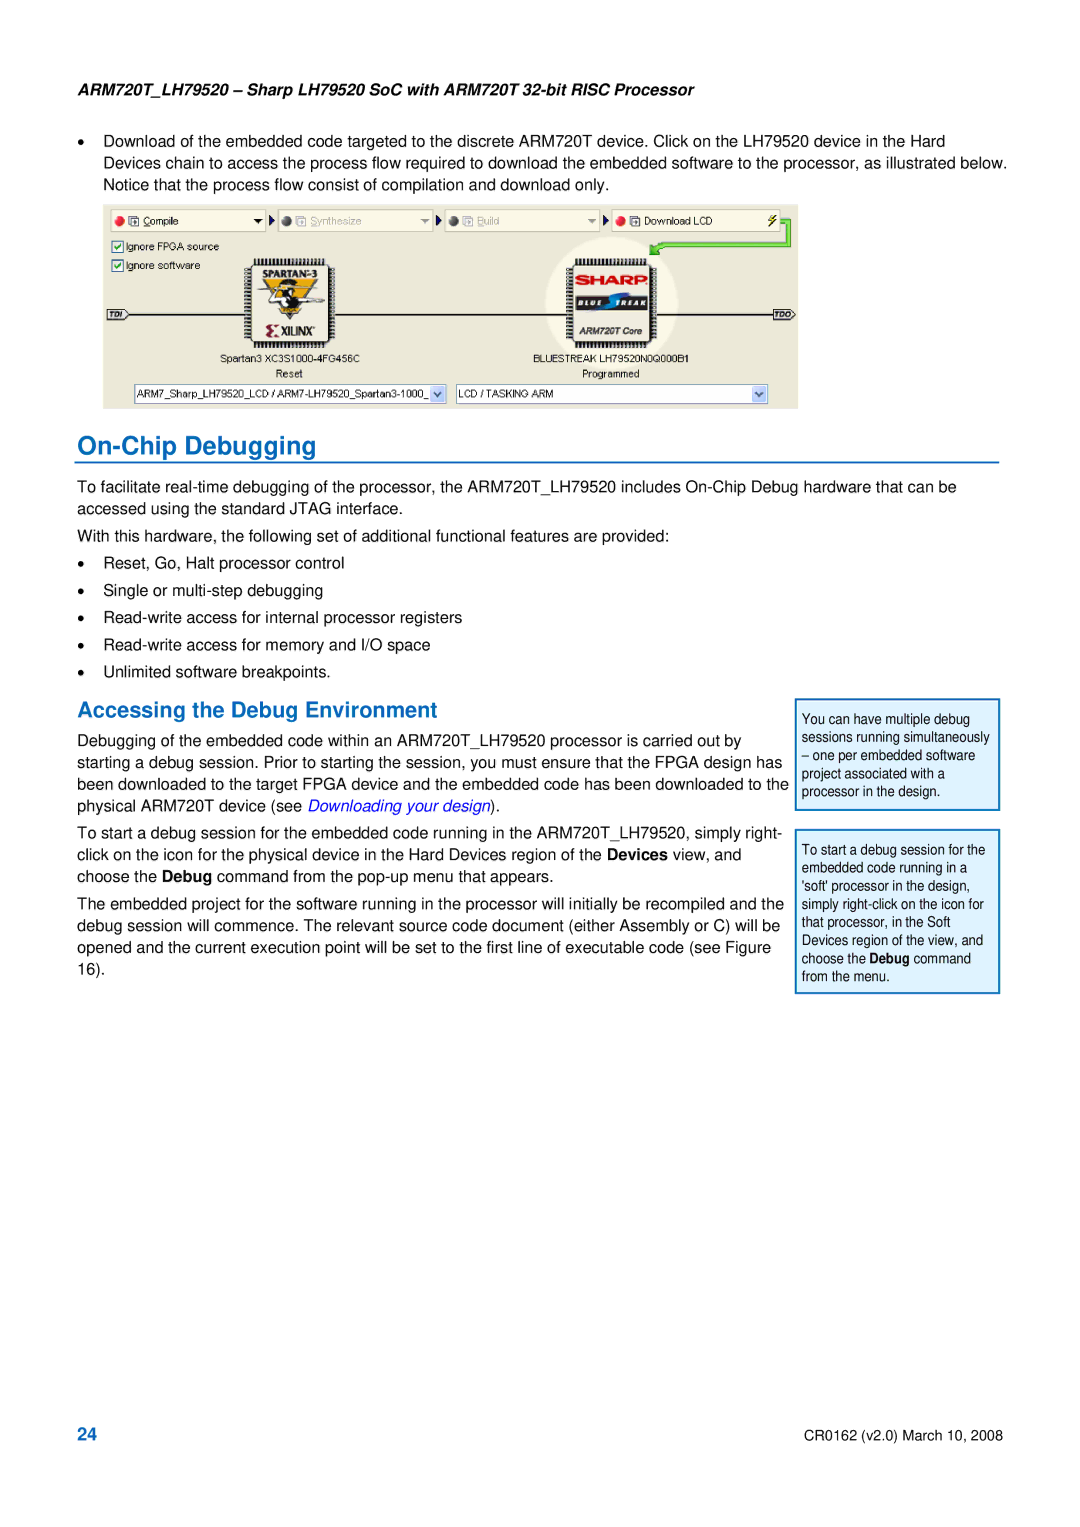
•Download of the embedded code targeted to the discrete ARM720T device. Click on the LH79520 device in the Hard Devices chain to access the process flow required to download the embedded software to the processor, as illustrated below. Notice that the process flow consist of compilation and download only.
On-Chip Debugging
To facilitate
With this hardware, the following set of additional functional features are provided:
•Reset, Go, Halt processor control
•Single or
•
•
•Unlimited software breakpoints.
Accessing the Debug Environment
Debugging of the embedded code within an ARM720T_LH79520 processor is carried out by starting a debug session. Prior to starting the session, you must ensure that the FPGA design has been downloaded to the target FPGA device and the embedded code has been downloaded to the physical ARM720T device (see Downloading your design).
To start a debug session for the embedded code running in the ARM720T_LH79520, simply right- click on the icon for the physical device in the Hard Devices region of the Devices view, and choose the Debug command from the
The embedded project for the software running in the processor will initially be recompiled and the debug session will commence. The relevant source code document (either Assembly or C) will be opened and the current execution point will be set to the first line of executable code (see Figure 16).
You can have multiple debug sessions running simultaneously
–one per embedded software project associated with a processor in the design.
To start a debug session for the embedded code running in a 'soft' processor in the design, simply
24 | CR0162 (v2.0) March 10, 2008 |