ARM720T_LH79520 – Sharp LH79520 SoC with ARM720T
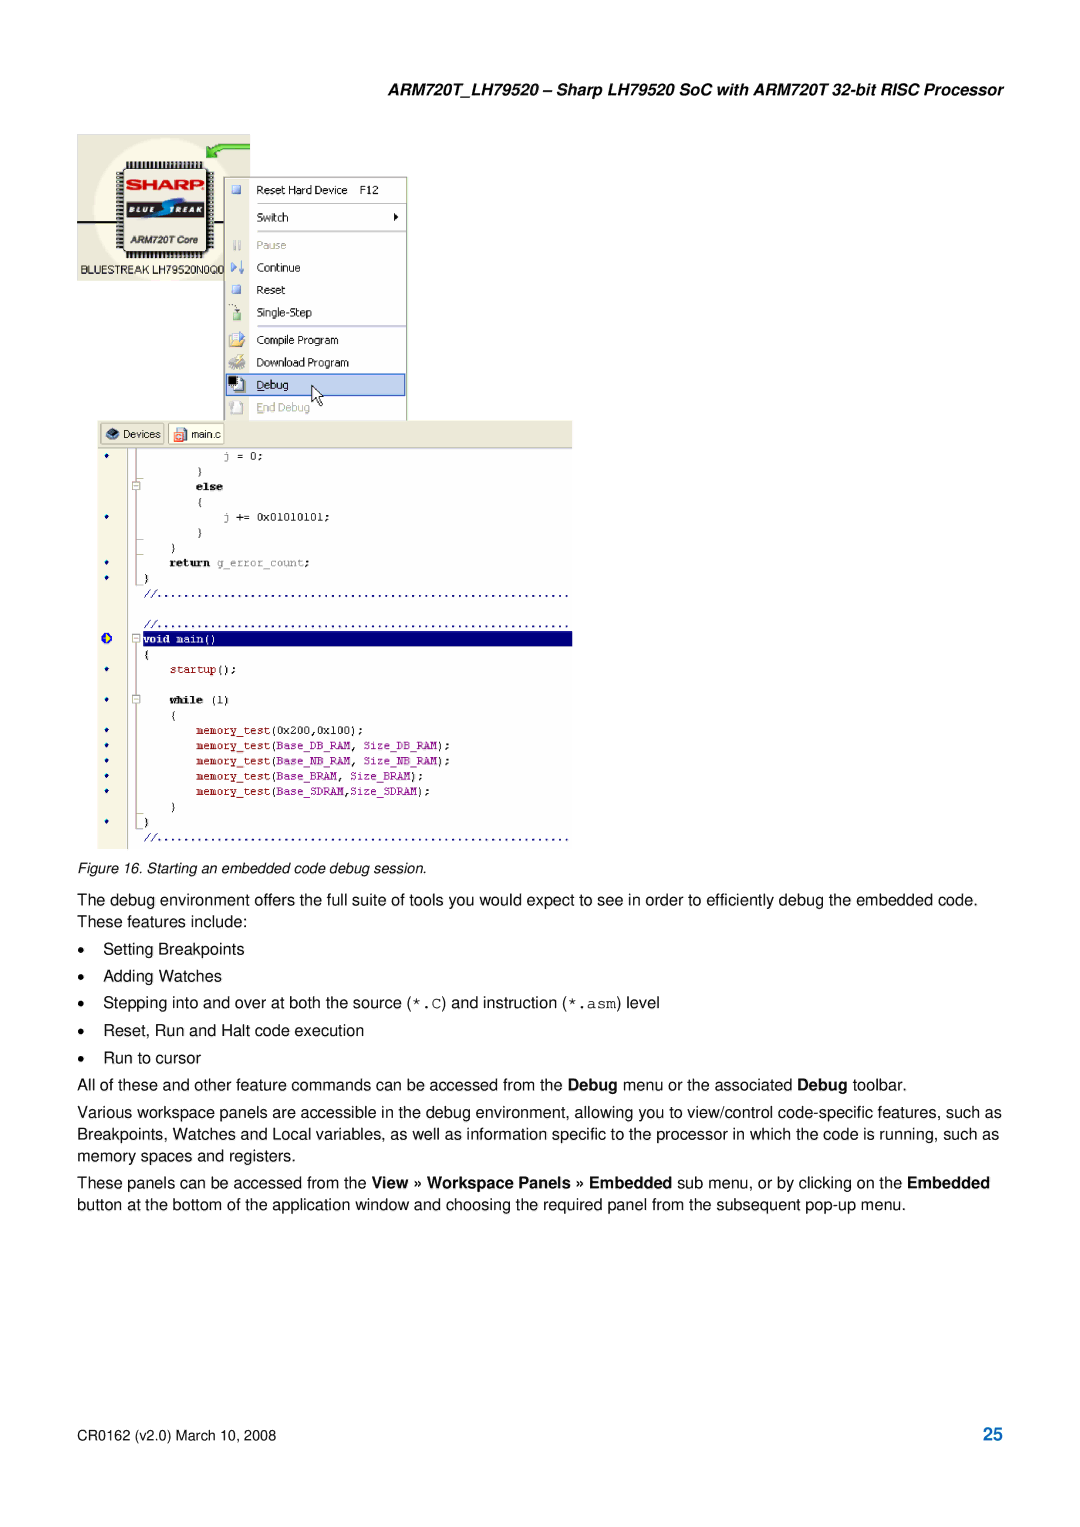
Figure 16. Starting an embedded code debug session.
The debug environment offers the full suite of tools you would expect to see in order to efficiently debug the embedded code. These features include:
•Setting Breakpoints
•Adding Watches
•Stepping into and over at both the source (*.C) and instruction (*.asm) level
•Reset, Run and Halt code execution
•Run to cursor
All of these and other feature commands can be accessed from the Debug menu or the associated Debug toolbar.
Various workspace panels are accessible in the debug environment, allowing you to view/control
These panels can be accessed from the View » Workspace Panels » Embedded sub menu, or by clicking on the Embedded button at the bottom of the application window and choosing the required panel from the subsequent
CR0162 (v2.0) March 10, 2008 | 25 |
