Registration Assistance
Sony Pictures Digital Inc
Table of Contents
Data window
Command descriptions Meters
Main screen
Toolbars
Saving a file
Using undo and redo
Creating a new data window
Editing audio
Creating and using views
Selecting audio using start and end values
Selecting audio during playback Fine-tuning a selection
Zooming and magnifying
Using command markers in streaming media files
Why use markers, regions, and the playlist?
Using markers
Changing the bit depth
Using the playlist
Using regions
Using the Regions List
Recording audio
Extracting audio from CDs
Finding and repairing audio glitches
Applying presets
Burning CDs
Channel Converter
Sound Forge processes Auto Trim/Crop
Bit-Depth Converter
DC Offset
Adding an effect
Swap Channels Time Stretch Volume
Adjusting envelopes
Adding a chain of effects
Troubleshooting Acoustic Mirror
What is Acoustic Mirror?
Using impulse files in creative ways
What is Wave Hammer?
Sound Forge and Midi timecode synchronization
Using the Midi Keyboard
Midi triggers
Samplers
Editing loops
Loops
Looping techniques
Crossfading loops
Adjusting Spectrum Analysis settings
Using a spectrum graph
Using a sonogram
Working in the frequency domain
About Ircam files About Bicsf and Ebicsf files Opening files
Saving files
Sample files
Introduction
Introducing Sound Forge
Full version of Sound Forge versus Screenblast Sound Forge
Getting help within Sound Forge
Installing Sound Forge
System requirements
Online help
About your rights in Sound Forge software
What’s This? help
Help on the Web
About Your Privacy Proper Use of Software
Defragmenting your hard drive
Optimizing for
Sound Forge
Increasing total buffer size
Turning off the play output meters
Increasing preload size
Turning off the playback cursor and record counter
Turning on passive updating for video and time displays
Turning on passive updating for video displays
Optimizing for Sound Forge
Using the mouse
Learning the Sound
Forge Workspace
Using the mouse wheel
Main screen
Main screen components
Floating and docking windows
Shortcut key Description
Data window
Component Description
Displaying data window components
Playbar
Floating a toolbar
Toolbars
Docking a toolbar
Displaying a toolbar
Standard toolbar
Transport bar
Navigation toolbar
Views toolbar
Status/Selection toolbar
Regions/Playlist toolbar
Process toolbar
Effects toolbar
Tools toolbar
Levels toolbar
Acid Loop Creation Tools toolbar
Play Device toolbar
Command descriptions
ToolTips
Turning off ToolTips
Resetting clipping indicators
Meters
Scaling meters
Holding peaks and valleys
Displaying VU/PPM meters
Showing labels
Scale Integration time
Controls
Faders and sliders
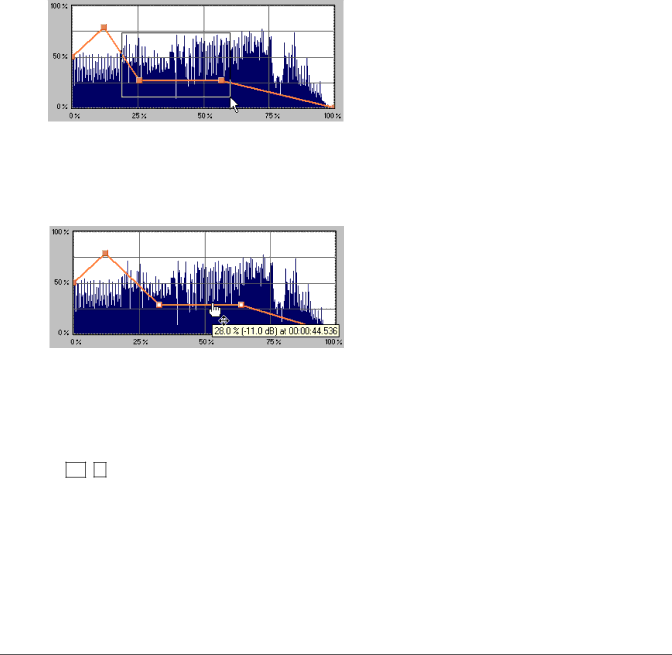
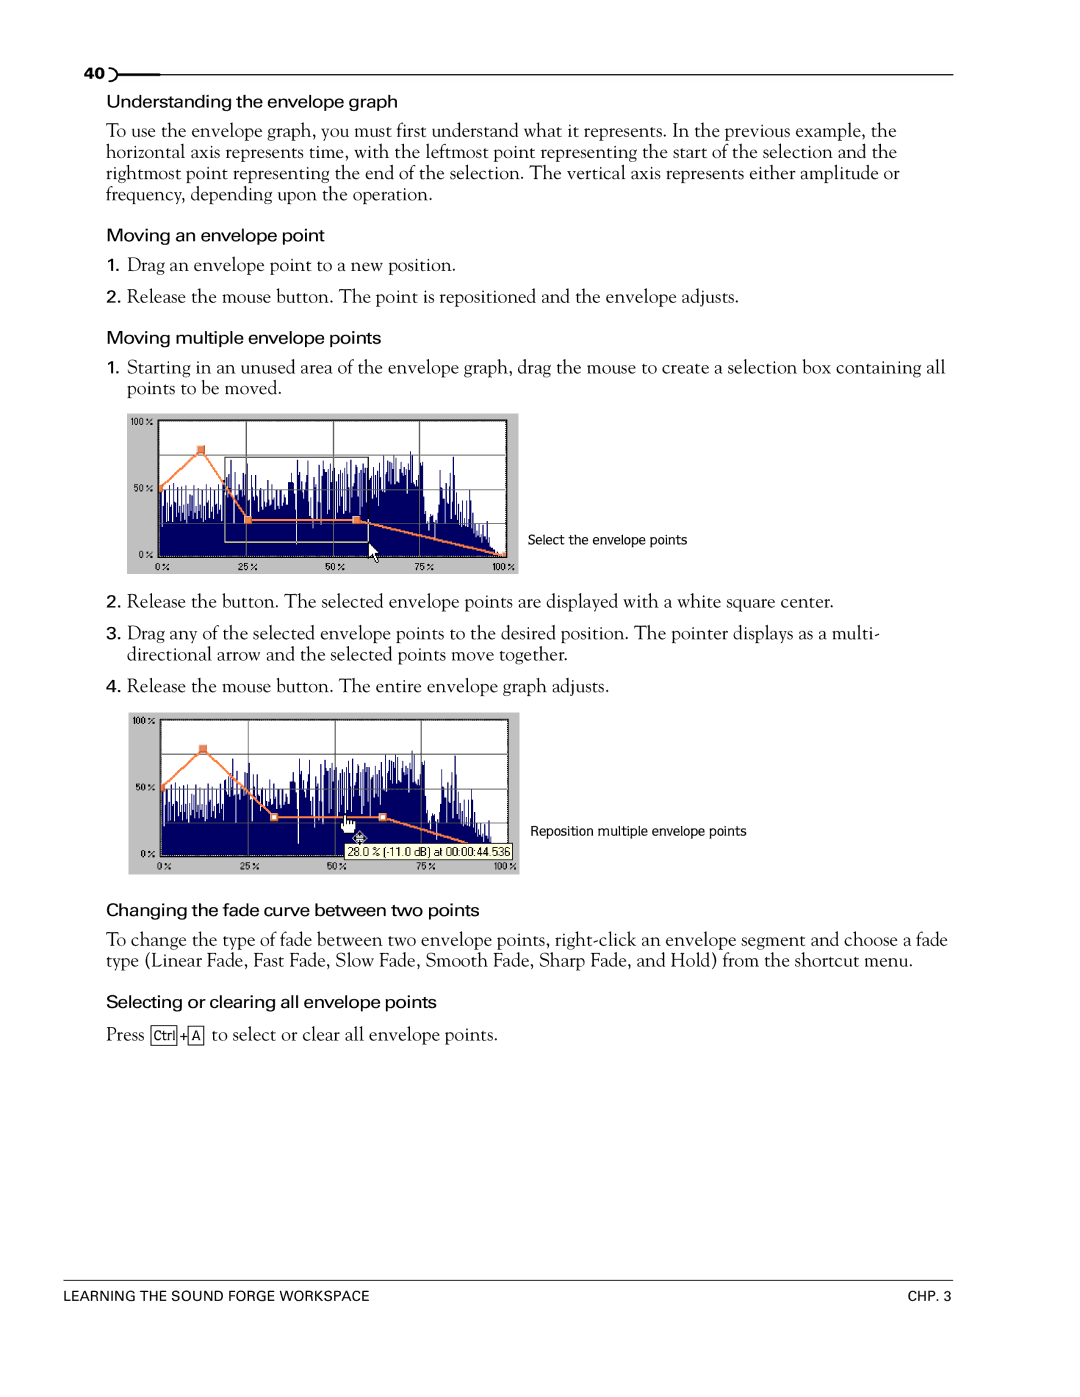
Envelope graphs
To select or clear all envelope points
Stereo files
Displaying the waveform on an envelope graph
Working with stereo files
Selecting data in stereo files
Toggling channel selections
Single-channel editing
Getting Started
Creating a project
Using the Open dialog
Getting media files
Using the Explorer window
Peak files
Working with video files
Playing a file
Viewing the current position
Playing a file from a specified point
Playing in Loop Playback mode
Playing a selection
Viewing selection status
Creating a new data window
Viewing selection statistics
Saving a file
Active data windows vs. inactive data windows
Copying data to a new file
Using the Save As dialog
Creating custom templates
Saving all open audio files
Editing audio
Saving files as a workspace
Copying
Pasting
Cutting
Deleting
Trimming/Cropping
Mixing
Using undo and redo
Using the Undo/Redo History window
Play the pre-mix file
Selecting status formats
Format name Description
Experimenting with status formats
Configuring the Measures & Beats format
Rendering files
Exporting to Net MD devices
Exporting to Clié handheld devices
Recovering files after a crash
Recovering files
Deleting recovered files
Setting the cursor position
Navigating Zooming, Selecting
Using the overview bar
Previewing audio with pre-roll
Understanding the overview bar
Navigating in the overview bar
Zooming and magnifying
Playing audio in the overview bar
Navigating with the audio event locator
Zooming the time ruler horizontal
Zooming the level ruler vertical
Full
Using custom zoom settings
Formatting the level ruler
Using zooming shortcuts
Using the Magnify tool
Zooming the time ruler with the Magnify tool
Selecting audio using start and end values
Using the Set Selection dialog
Adjusting a selection with the keyboard
Fine-tuning a selection
Adjusting a selection with the mouse
Selecting audio during playback
Creating and using views
Understanding snapping
Displaying the Views toolbar
Creating views
NAVIGATING, ZOOMING, and Selecting
Editing attributes in the Properties dialog
Changing File Attributes Formats
Editing file attributes
Editing attributes in the status bar
Changing the sample rate
Changing the bit depth
Increasing bit depth
Decreasing bit depth
Understanding dither and noise shaping
Minimizing quantization error
Converting mono/stereo channels
Converting from mono to stereo
Converting from stereo to mono
Using the Channel Converter
Converting file formats
Save as type
Adding summary information
Viewing and editing summary information
Viewing extended summary information
Editing extended summary information
Saving summary information
Including additional embedded information
Using Markers Regions, Playlist/Cutlist
Why use markers, regions, and the playlist?
Using markers
Inserting markers
Naming markers
Customizing automatic labeling
Changing the marker position
Using markers to create regions
Detecting and marking clipping
Using command markers in streaming media files
Defining streaming media commands
Command Player type Description
Defining Scott Studios data commands
Inserting command markers
Command Description
Moving the cursor to a command marker
Editing command properties
Saving command properties as a custom template
Deleting command markers
Using regions
Inserting regions
Inserting regions automatically
Parameter Description
Editing regions
While
Creating new files from regions
Working with the Regions List
Using the Regions List
Displaying the Regions List
Regions List
Changing region order
Using the playlist
Displaying the playlist
Adding regions to the playlist
Repeating a region during playlist playback
Understanding the playlist display
Customizing the playlist display
Playlist
Playing from the playlist
Arranging the playlist
Replicating a region in the playlist
Using stop points
Deleting a region from the playlist
Creating a new file from the playlist
Configuring the playlist as a cutlist
Saving a playlist/cutlist file
Opening a playlist/cutlist file
Copying the playlist/cutlist to the clipboard
112
Recording Extracting, Burning
Recording audio
Recording manually
114
Recording automatically
Triggering by a set threshold
Recording a specific length punch-in
Specifying a punch-in location at the time of recording
Choosing a recording mode
Automatic retake automatically rewind
Adjusting for DC offset
Playing back recorded audio
Mini-transport bar in Record dialog
Using remote recording mode
Synchronizing with other devices
Viewing input levels
Inserting markers while recording
Configuring gap detection
Automatically labeling windows and regions
Changing blinking status
Extracting audio from CDs
Type drop-down list in the Open dialog
Burning CDs
129
Proper use of software
Closing a CD
Crossfading
Editing, Repairing Synthesizing Audio
Crossfading, overwriting, and replicating
Overwriting
Replicating
Create a selection containing Sound editing just gets easier
Dragging mono selections into stereo destinations
Using drag-and-drop
Repeating an operation
Snapping to events in drag-and-drop operations
Pasting, mixing, and crossfading with drag-and-drop
Mixing
Finding and repairing audio glitches
Creating new windows with drag-and-drop
Locating glitches
Repairing audio
Open the file containing the glitch
Repairing audio glitches manually with the Pencil tool
Synthesizing audio
Generating DTMF/MF tones
Generating audio with frequency modulation
Specifying the number and arrangement of operators
Generating simple waveforms
Applying presets
Using presets
Processing Audio
Previewing processed audio
Preview parameters
Sound Forge processes
Bypassing a process while previewing
Auto Trim/Crop
Using Auto Trim/Crop
Preset Description
Auto Trim/Crop controls
Bit-Depth Converter
Minimum inter-phrase silence
Converting a file’s bit depth
Channel Converter
Channel Converter controls
Control Description
DC Offset
Estimating DC Offset
DC Offset controls
Fade Graphic fade
Creating a graphic fade
Fade Fade
Creating a custom graphic fade
Graphic Fade Controls
Inserting silence into a file
Fade Fade Out
Insert Silence
Insert Silence controls
Normalize
Invert/Flip
Mute
Muting an audio selection
Normalizing Audio
Normalize Controls
Normalize to
Pan/Expand
Option Description
Creating a pan
Creating a custom pan
Resample
Pan/Expand controls
Downsampling audio
Upsampling audio
Resample controls
Reverse
Smooth/Enhance
Swap Channels
Volume
Increasing the volume of a selection
Time Stretch
Volume control
168
Applying Effects
Adding an effect
Saving effect settings as a custom preset
Adding a chain of effects
Applying effects using the Plug-In Chainer
Adding plug-ins to a chain
Selecting the processing mode for audio tail data
Arranging plug-ins on a chain
Bypassing effects
Removing plug-ins from a chain
Configuring chained plug-ins
Saving individual plug-in settings as a custom preset
Saving plug-in chains
Using the Plug-In Manager window
Managing effects
Loading plug-in chains
Using the Preset Manager
Organizing effects in the DX Favorites menu
Adding a volume or panning envelope
Automating Effect Parameters
Adding an effect automation envelope
Applying effects automation
Adjusting effect parameters with envelopes
Previewing effect automation
Showing or hiding effect automation envelopes
Adding envelope points
Adjusting envelopes
Removing effect automation envelopes
Flipping an envelope
Setting fade properties
Cutting, copying, and pasting envelope points
Copying an envelope to another data window
182
What is Acoustic Mirror?
Adding an acoustic signature to an audio file
Acoustic signature
Adjusting the acoustic signature
Acoustic Mirror dialog
General tab controls
Envelope tab controls
Summary tab controls
Recover tab controls
Forge CD-ROM
Creating impulse files
What you need to create custom impulses
Recording the impulse in an acoustic space
Recording the impulse through an electronic device
Recovering the impulse
Trimming the impulse file
Adding summary information to your impulse file
Processing individual audio elements
Using impulse files in creative ways
Using the new impulse file
Adding realistic stereo to mono recordings
Recreating spaces for foley effects and dialog replacement
Panning with head-related transfer functions
File Name Impulse positioning
Troubleshooting Acoustic Mirror
Impulses do not recover properly
Stuttering during real-time previewing
Recovered impulse is too noisy
Error message explanations
Displaying Wave Hammer
What is Wave Hammer?
Wave Hammer dialog
Compressor tab
Attack time
Volume Maximizer tab
200
Midi triggers
What is MIDI?
Working with 13 MIDI/SMPTE
Playback versus triggered playback
Triggering file playback
Triggering region playback
Using region playback triggers
Advantages of external Midi controllers
Playing regions using MTC from a sequencer
Sound Forge and Midi timecode synchronization
Playing regions using MTC from an external device
Using Sound Forge to generate MTC for a Midi sequencer
Using Sound Forge to generate MTC for an external device
Sampling
Samplers
External samplers
Configuring the Sampler Tool
Internal samplers
Creating a sampler configuration
Open loop versus closed loop
Sending a sample
Saving sampler configurations
Sending and receiving samples
Receiving a sample
Displaying the Midi Keyboard
Using the Midi Keyboard
Midi unity note and Fine tune
Turning on the Midi Keyboard
Specifying instruments
Configuring the Midi Keyboard output port and channel
Troubleshooting the Midi Keyboard
Generating chords
Setting up MIDI/SDS hardware
Troubleshooting MIDI/SDS with open loop
Setting up SCSI/SMDI hardware
Periodic transfer failures
Troubleshooting SCSI/SMDI
Conflicting Scsi IDs
Sampler is recognized but does not transfer reliably
Adaptec 1540/1542CF does not recognize a sampler
Looping
Loops
Sustaining and release loops
Creating a sustaining loop
Creating a sustaining loop with a release loop
Match endpoint waveform slope
Looping techniques
Match endpoint amplitudes
Match endpoint sound levels
Editing a loop without the Loop Tuner
Editing loops
Avoid very short loops
Editing a loop with the Loop Tuner
Loop Tuner
Switching between the sustain and release loops
Crossfading loops
Using the Crossfade Loop tool
Creating loops for Acid
Creating an Acid one-shot file
Creating an Acid loop file
Creating an Acid 2.0 disk-based file
Using the Acid Loop Creation Tools toolbar
Creating an Acid beatmapped file
Editing loops for Acid
Halving or doubling a loop
Shifting a selection left or right
Rotating audio
Setting loop tempo
Saving loop points
234
Using the video strip
Working with Video
Viewing video
Enabling frame animation
Animating the video strip
Previewing files with video
Video Preview window
Button Description
Using an external monitor
Display square
Attaching video to an audio file
Setting video options
Detaching video from an audio file
Video file properties
Configuring your video settings
Saving a video file
Items Description
243
244
Using Spectrum Analysis
Working in the frequency domain
Using a spectrum graph
Fast Fourier Transform
Displaying a spectrum graph
Monitoring an input and output source
Navigating a spectrum graph
Changing the graph type
Changing the zoom level
Updating a spectrum graph
Viewing multiple spectrum graphs
Printing the graph
Using a sonogram
Displaying a sonogram
Tuning a sonogram
Updating a sonogram
Adjusting Spectrum Analysis settings
Returning to a spectrum graph
Printing the sonogram
Frequency minimum
Saving spectrum graph settings
256
Shortcuts
Project file commands
Magnification and view commands
Keyboard shortcuts
Data window edit commands
+ P
Press
259
Cursor movement
Press Cursor moves to
+ +
+ Z
Selecting data
Press To select from cursor to
+ L
+ K
Navigation and playback
Record dialog keyboard shortcuts
+ F7
Plug-In Chainer
Regions List
Playlist
Mouse wheel shortcuts
Additional mouse shortcuts
Mouse wheel action Result
Hold Ctrl and click to preview a Cut operation. Hold
266
Microsoft Audio Compression Manager
Audio data compression and decompression
268
Smpte Drop Frame 29.97 fps, Video
Smpte Timecode
Smpte 25 EBU 25 fps, Video
Smpte Non-Drop Frame 29.97 fps, Video
Smpte 30 30 fps, Audio
Smpte Film Sync 24 fps
About Ircam files
Using Csound
Ebicsf Files
About Bicsf and Ebicsf files
Saving files
Index
122
Csound
Cursor position Custom graphic fade
Iii
MIDI/SDS SCSI/SMDI
Index
Preload size Pre-roll to cursor Preset Manager
Plug-ins,See Effects
Vii
Viii
Displaying Effects Levels Navigation Play Device
SCSI/SMDI