Sun Microsystems, Inc Network Circle Santa Clara, CA
Sun GlassFish Enterprise Server 2.1 Administration Guide
090122@21808
Contents
Jdbc Resources
Java Business Integration
Configuring JMS Provider Properties
Accessing Remote Servers
IBM Informix Type 4 Driver CloudScape 5.1 Type 4 Driver
Foreign JMS Providers
Web and EJB Containers
Configuring Security
127
149
141
Virtual Servers 149 Http Listeners 150
153
158
What is the ORB? 162 Iiop Listeners
161
163
Tuning the JVM Settings 219
About Management Rules 215 Configuring Management Rules 216
215
219
Profiler and SSL Commands
Asadmin Utility
231
244
Page
Figures
Page
JVM Statistics for Java SE Runtime 189
Tables
Server Lifecycle Commands 237
Remote Commands Required Options 234
List and Status Commands 238
Deployment Commands 239
Examples
Page
Sun GlassFish Enterprise Server Documentation Set
Preface
Table P-1Books in the Enterprise Server Documentation Set
Table P-2Default Paths and File Names
Default Paths and File Names
Symbol Conventions
Symbol Conventions
Typographic Conventions
Table P-3Typographic Conventions
Third-Party Web Site References
Documentation, Support, and Training
Sun Welcomes Your Comments
Enterprise Server Overview and Concepts
Enterprise Server Overview
Enterprise Server Overview
This section contains the following topics
Admin Console
Tools for Administration
For example
Http//hostnameport
To list the commands available within asadmin
Command-line Interface asadmin Utility
JConsole
Enterprise Server Concepts
Domain Administration Server DAS
Domain
Usage Profiles
1Features Available for Each Profile
Cluster
Features Available for Each Profile
Node Agent
1Enterprise Server Instance
Server Instance
2Enterprise Server Listeners that Use Ports
Ports in the Enterprise Server
Creating a Domain
Basic Enterprise Server Commands
Http//hostname5000
Listing Domains
Deleting a Domain
Starting the Domain
Stopping the Default Domain on Windows
Starting the Default Domain on Windows
Stopping the Domain
Restarting the Domain
Stopping a Cluster
Starting a Cluster
Creating a Node Agent
Starting a Node Agent
Starting an Instance
Stopping a Node Agent
Stopping an Instance
Restarting an Instance
To migrate the DAS
Recreating the Domain Administration Server
Change
Page
Java Business Integration
Service Engines
JBI Environment
JBI Components
JBI Component Loggers
Binding Components
Service Assemblies
JBI Descriptors
Shared Libraries
Jdbc Resources
Jdbc Resources
How Jdbc Resources and Connection Pools Work Together
Jdbc Connection Pools
Setting Up Database Access
Creating a Jdbc Connection Pool
Working with Jdbc Connection Pools
Click OK
Editing a Jdbc Connection Pool
Change connection validation settings
By calling the con.getAutoCommit and con.getMetaData methods
Editing Jdbc Connection Pool Advanced Attributes
Creation Retry Attempts is greater than
Configurations for Specific Jdbc Drivers
Configurations for Specific Jdbc Drivers
DataSource Classname Specify one of the following
Java DB Type 4 Driver
DataSource Classname com.sun.sql.jdbcx.db2.DB2DataSource
Sun GlassFish Jdbc Driver for DB2 Databases
Sun GlassFish Jdbc Driver for Microsoft SQL Server Databases
DataSource Classname com.ibm.db2.jcc.DB2SimpleDataSource
IBM DB2 8.1 Type 2 Driver
DeferPrepares Set to false
DataSource ClassnameSpecify one of the following
Inet Oraxo Jdbc Driver for Oracle 8.1.7 and 9.x Databases
MySQL Type 4 Driver
Com.mysql.jdbc.jdbc2.optional.MysqlDataSource
DataSource Classname com.inet.ora.OraDataSource
Inet Merlia Jdbc Driver for Microsoft SQL Server Databases
DataSource Classname com.inet.tds.TdsDataSource
Jdbcinetoralocalhost1521payrolldb
DataSource Classname com.inet.syb.SybDataSource
Inet Sybelux Jdbc Driver for Sybase Databases
Jdbcoraclethin@localhost1521customerdb
OCI Oracle Type 2 Driver for Oracle 8.1.7 Databases
Jdbcoracleoci@localhost1521customerdb
CloudScape 5.1 Type 4 Driver
IBM Informix Type 4 Driver
DataSource Classname com.ibm.db2.jcc.DB2DataSource
Page
JMS Resources
Configuring Java Message Service Resources
Relationship Between JMS Resources and Connector Resources
JMS Destination Resources
JMS Connection Factories
JMS Physical Destinations
Configuring JMS Provider Properties
Foreign JMS Providers
Accessing Remote Servers
Resource Adapter Properties
Configuring the Generic Resource Adapter
False
Foreign JMS Providers
ManagedConnectionFactory Properties
Activation Spec Properties
Administered Object Resource Properties
Configuring Java Message Service Resources
Message causes a runtime exception
Creating a JavaMail Session
Configuring JavaMail Resources
Creating a JavaMail Session
Jndi Resources
Java EE Naming Services
Naming References and Binding Information
Using External Jndi Repositories and Resources
Using Custom Resources
1JNDI Lookups and Their Associated References
Using External Jndi Repositories and Resources
An Overview of Connectors
Connector Resources
To Create a Connector Connection Pool
Managing Connector Connection Pools
Specify this name when creating a connector resource
Create-connector-connection-pool
To Edit a Connector Connection Pool
Same transaction level as that specified in resource
To Edit Connector Connection Pool Advanced Attributes
Pool. Default value is false
To create security maps for connector connection pools
To Delete a Connector Connection Pool
To Edit Security Maps for Connector Connection Pools
To Edit Connection Pool Properties
To Set Up EIS Access
Managing Connector Resources
To Create a Connector Resource
Delete-connector-connection-pool
To Delete a Connector Resource
To Edit a Connector Resource
Create-connector-resource
To Configure the Connector Service
Managing Administered Object Resources
Delete-connector-resource
To Create an Administered Object Resource
To Delete an Administered Object Resource
To Edit an Administered Object Resource
Create-admin-object
Delete-admin-object
SIP Servlet Container
Web and EJB Containers
Editing SIP Container General Attributes
Editing the Properties of the SIP Container
Editing SIP Container Session Properties
EJB Container
Web Container
Editing SIP Container Session Manager Properties
Page
Understanding Application and System Security
Configuring Security
Tools for Managing Security
Encrypting a Password in the domain.xml File
Managing Security of Passwords
Asadmin create-password-alias --user admin alias-name
Asadmin create-password-alias --user admin jms-password
Changing the Master Password
Protecting Files with Encoded Passwords
Restart the Enterprise Server for the relevant domain
Restart the Enterprise Server
Working with the Master Password and Keystores
Changing the Admin Password
Authenticating Entities
About Authentication and Authorization
1Enterprise Server Authentication Methods
Specifying Jacc Providers
Authorizing Users
Verifying Single Sign-On
Understanding Users, Groups, Roles, and Realms
Configuring Message Security
Groups
Users
Realms
Roles
Create a Jdbc realm
To Configure a Jdbc Realm for a Web, EJB Application
About Digital Certificates
Introduction to Certificates and SSL
Following topics are discussed in this section
About Certificate Chains
About Secure Sockets Layer
About Ciphers
Using Name-based Virtual Hosts
About Certificate Files
About Firewalls
Using the keytool Utility
Using Java Secure Socket Extension Jsse Tools
Changing the Location of Certificate Files
Delete a certificate from a keystore of type JKS
Display certificate information from a keystore of type JKS
Generating a Certificate Using thekeytool Utility
Certificate was added to keystore Saving cacerts.jks
Deleting a Certificate Using thekeytool Utility
Storepass password
Using Network Security Services NSS Tools
Keytool -delete
Verify the certificates generated in the previous bullet
Using the certutil Utility
Display available certificates
Certutil -L -d $CERTDBDIR
Move a certificate from an NSS database to JKS format
Delete a certificate from an NSS certificate database
Add a new PKCS11 module or token
Modutil -list -dbdir $admin.domain.dir/$admin.domain/config
Delete a PKCS11 module from an NSS store
List available token modules in an NSS store
About Configuring Hardware Crypto Accelerators
Using Hardware Crypto Accelerator With Enterprise Server
Standard output will look similar to the following
Configuring PKCS#11 Tokens
Modutil -list -dbdir Asnssdb
This section describes the following topics
Managing Keys And Certificates
Standard output will be similar to the following
Listing Keys and Certificates
Configuration for the SCA 1000 hardware accelerator
Configuring J2SE 5.0 PKCS#11 Providers
Working With Private Keys and Certificates
Name=HW1000 Library=/opt/SUNWconn/crypto/lib/libpkcs11.so
Property name=mytoken value=&InstallDir/mypkcs11.cfg
126
Overview of Message Security
Configuring Message Security
Understanding Message Security in the Enterprise Server
System Administrator
Assigning Message Security Responsibilities
Application Developer
Application Deployer
About Username Tokens
About Encryption
About Digital Signatures
About Message Protection Policies
Response Policy
Glossary of Message Security Terminology
Securing a Web Service
Configuring Application-Specific Web Services Security
Configuring the Enterprise Server for Message Security
Securing the Sample Application
Actions of Request and Response Policy Configurations
Configuring a JCE Provider
Configuring Other Security Facilities
After You Finish
Security.provider.1=sun.security.provider.Sun
Save and close the file
Enabling Providers for Message Security
Message Security Setup
To specify the default server provider
Configuring the Message Security Provider
To specify the default client provider
Enabling Message Security for Application Clients
Creating a Message Security Provider
Response-policy
Further Information
What is the Diagnostic Framework?
Configuring the Diagnostic Service
Diagnostic Service Framework
Generating a Diagnostic Report
Transactions
What is a Transaction?
About Transactions
Transactions in Java EE Technology
What is a Transaction? on Configuring Transactions on
Configuring Transactions
Admin Console Tasks for Transactions
This section explains how to configure transaction settings
Workarounds for Specific Databases
Set any needed properties
To set a transaction timeout value
To set the location of the transaction logs
To set the keypoint interval
Default value is
Virtual Servers
Configuring the Http Service
Http Listeners
Configuring the Http Service 151
152
Overview of Web Services
Managing Web Services
Java EE Web Service Standards
Web Services Standards
Deploying Web Services
Deploying and Testing Web Services
Viewing Deployed Web Services
Using Web Services Registries
Testing Web Services
Web Services Security
Adding a Registry
Publishing a Web Service to a Registry
Transforming Messages with Xslt Filters
Monitoring Web Services
Monitoring Web Service Messages
Viewing Web Service Statistics
160
An Overview of the Object Request Broker
Configuring the Object Request Broker
What is the ORB?
Configuring the ORB
Managing Iiop Listeners
Iiop Listeners
Thread Pools
Working with Thread Pools
About Logging
Configuring Logging
Log Records
1Enterprise Server Logger Namespaces
Logger Namespace Hierarchy
JTS
Enterprise Server Logger Namespaces
Configuring General Logging Settings
Configuring Logging
Configuring Log Levels
171000.000
Viewing Server Logs
Details
ThreadID=13
About Monitoring
Monitoring Components and Services
Monitoring in the Enterprise Server
About the Tree Structure of Monitorable Objects
Overview of Monitoring
Applications Tree
Following sections describe these sub-trees
Http Service Tree
JMS Service Tree
Connector Service Tree
Resources Tree
ORB Tree
About Statistics for Monitored Components and Services
Thread Pool Tree
Orb Connection-managers Connection-manager-1
1EJB Statistics
EJB Container Statistics
3EJB Session Store Statistics
2EJB Method Statistics
EJB Session Store Statistics
5EJB Cache Statistics
4EJB Pool Statistics
Web Container Statistics
6Timer Statistics
7Web Container Servlet Statistics
8Web Container Web Module Statistics
Http Service Statistics
Jdbc Connection Pools Statistics
9HTTP Service Statistics Developer Profile
10JDBC Connection Pool Statistics
11Connector Connection Pool Statistics
JMS/Connector Service Statistics
Statistics for Connection Managers in an ORB
12Connector Work Management Statistics
13Connection Manager in an ORB Statistics
15Transaction Service Statistics
Transaction Service Statistics
Thread Pools Statistics
14Thread Pool Statistics
Java Virtual Machine JVM Statistics
15 Transaction Service Statistics
JVM Statistics
17JVM Statistics for Java SE- Class Loading
19JVM Statistics for Java SE- Garbage Collection
18JVM Statistics for Java SE- Compilation
20JVM Statistics for Java SE- Memory
21JVM Statistics for Java SE Operating System
Following table
22JVM Statistics for Java SE Runtime
23JVM Statistics for Java SE Thread Info
24JVM Statistics for Java SE Threads
Enabling and Disabling Monitoring
To Configure Monitoring Levels Using asadmin
Configuring Monitoring Levels Using the Admin Console
Returns
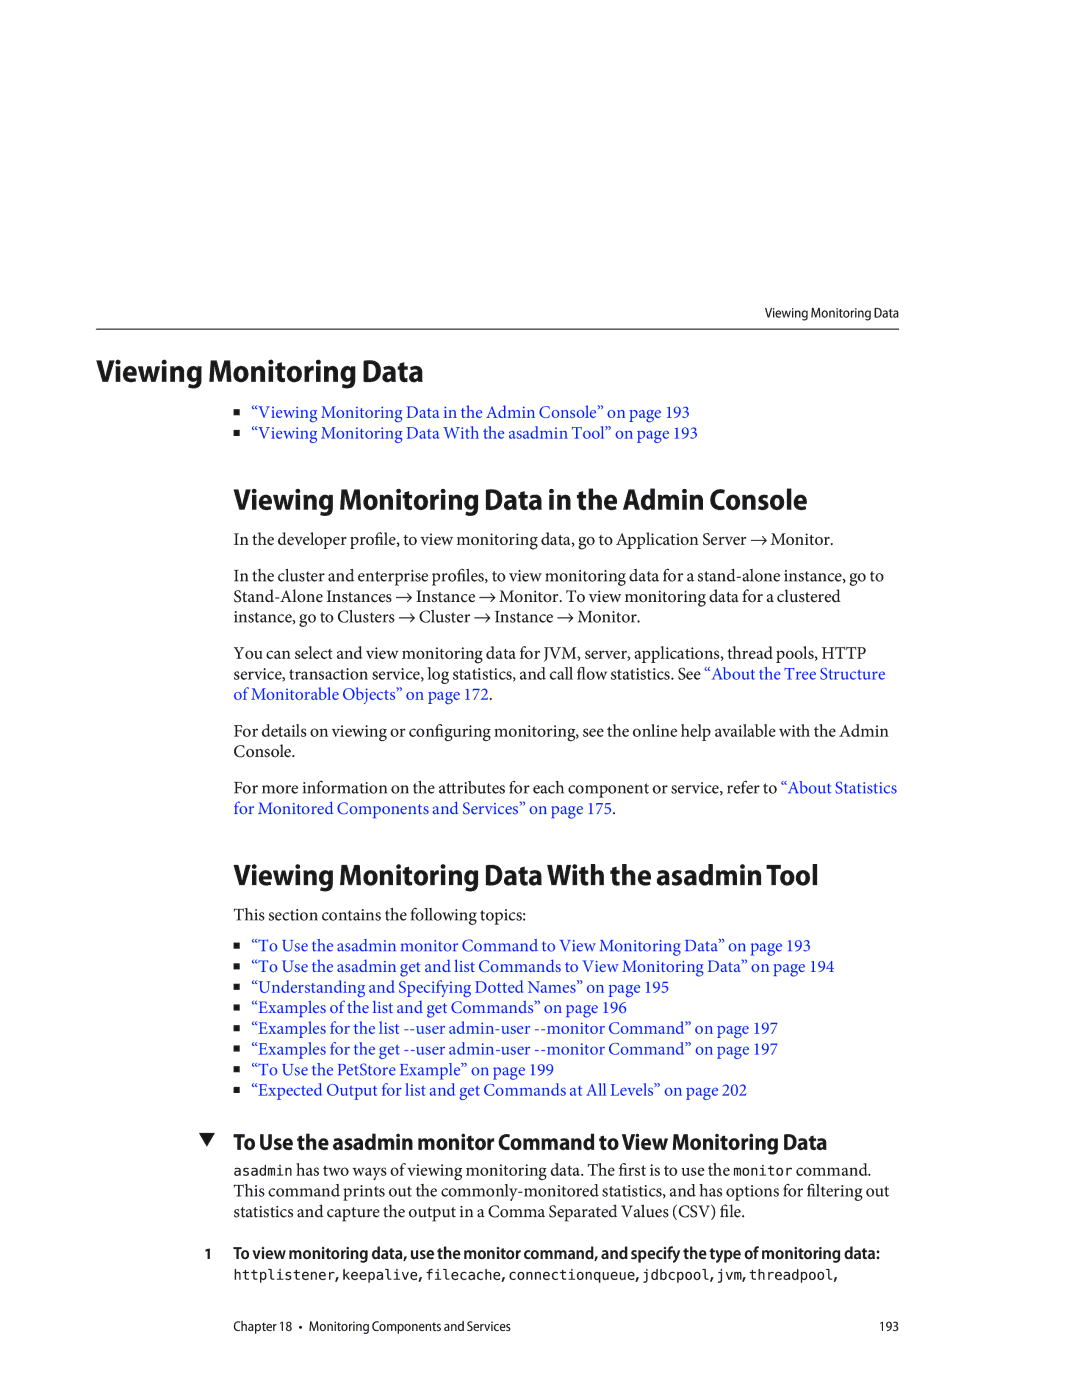
Viewing Monitoring Data With the asadmin Tool
Viewing Monitoring Data in the Admin Console
To Use the asadmin monitor Command to View Monitoring Data
Viewing Monitoring Data
531628032 45940736
Asadmin get --user adminuser --monitor server.jvm
Command returns the following attributes and data
Server.http-service
Understanding and Specifying Dotted Names
Server.applications.petstore
Examples of the list and get Commands
Examples for the get --user admin-user --monitor Command
Examples for the list --user admin-user --monitor Command
Asadmin list --user admin-user--monitor server
Asadmin list --user admin-user--monitor server.applications
Attempt to get all attributes from a Java EE application
Asadmin get --user admin-user--monitor server.jvm
To Use the PetStore Example
Asadmin get --user admin-user--monitor server.jvm.badname
Attempt to get a specific attribute from a subsystem
Returns output will be similar to
Asadmin list -m server.applications.petstore.signon-ejbjar
Server.http-service Server.resources Server.thread-pools
Returns with dotted name removed for space considerations
Monitoring Components and Services 201
Expected Output for list and get Commands at All Levels
Applications Level
Top Level
Application has been deployed. It is not applicable if a
Monitoring Components and Services 205
List -m Server.applications.app1
29Thread-Pools Level
28HTTP-Service Level
Resources Level
31Transaction-Service Level
ORB Level
Level
Using JConsole
JVM Level
Securing JConsole to Application Server Connection
Connecting JConsole to Application Server
Prerequisites for Connecting JConsole to Application Server
Connecting JConsole Securely to Application Server
Monitoring Components and Services 213
214
About Management Rules
Configuring Management Rules
Configuring Management Rules
Configuring Management Rules 217
218
Tuning the JVM Settings
Java Virtual Machine and Advanced Settings
Configuring Advanced Settings
Restarting Automatically on Solaris
Automatically Restarting a Domain or Node Agent
This Appendix contains the following topics
Restarting Automatically on Solaris
Restarting Automatically on the Microsoft Windows Platform
Creating a Windows Service
Start= auto DisplayName= display-name
Security for Automatic Restarts
Process name=as-service-name Sysproperty key=-Xrs
Jvm-options-Xrs/jvm-options
226
Top Level Elements
Dotted Name Attributes for domain.xml
Top Level Elements
Elements Not Aliased
Elements Not Aliased
230
Asadmin Utility
Asadmin Utility
Appendix C The asadmin Utility 233
Table C-1Remote Commands Required Options
Common Options for Remote Commands
Prefix followed by the password name in uppercase letters
Multimode Command
Get, Set, and List Commands
Table C-2Server Lifecycle Commands
Server Lifecycle Commands
Table C-2 Server Lifecycle Commands
List and Status Commands
Table C-3List and Status Commands
Table C-4Deployment Commands
Deployment Commands
Message Queue Administration Commands
Version Commands
Table C-5Version Commands
Table C-6Message Queue Commands
Table C-7Resource Management Commands
Resource Management Commands
Table C-7 Resource Management Commands
Http and Iiop Listener Commands
Configuration Commands
Lifecycle and Audit Module Commands
Table C-8IIOP Listener Commands
JVM Options and Virtual Server Commands
Profiler and SSL Commands
Table C-9Lifecycle Module Commands
Table C-10Profiler and SSL Commands
Transaction and Timer Commands
Threadpool and Auth-Realm Commands
Table C-11JVM Options and Virtual Server Commands
Table C-12Threadpool and Auth-Realm Commands
Registry Commands
User Management Commands
Table C-13Transaction Commands
Table C-14Transaction Commands
Database Commands
Rules and Monitoring Commands
Table C-16Rules and Monitoring Commands
Web Service Commands
Diagnostic and Logging Commands
Table C-17Database Commands
Table C-18Diagnostic and Logging Commands
Table C-20Security Commands
Security Service Commands
Table C-21Password Commands
Password Commands
Custom MBean Commands
Verify Command
Service Command
Table C-25Property Command
Property Command
ACC
Index
JMS
Logging ORB
256