About Monitoring
EXAMPLE
applications
ejb1 * |
|
| |||
| cache (for entity/sfsb) * | ||||
| pool (for slsb/mdb/entity) * | ||||
| methods | ||||
|
| method1 * | |||
|
| method2 * | |||
| |||||
| timers (for s1sb/entity/mdb) * | ||||
| ||||||
|
| servlet1 | * | |||
|
| servlet2 | * | |||
|
|
| ||||
| ||||||
|
| servlet3 * |
| |||
|
| servlet4 * |
| |||
| ||||||
|
| servlet3 *(same servlet on different vs) | ||||
|
| servlet5 * |
| |||
|
|
| ||||
ejb2 * |
|
|
| |||
| cache (for entity/sfsb) * | |||||
| pool (for slsb/mdb/entity) * | |||||
| methods |
| ||||
|
| method1 * |
| |||
|
| method2 * |
| |||
application2 |
|
|
|
| ||
The HTTP Service Tree
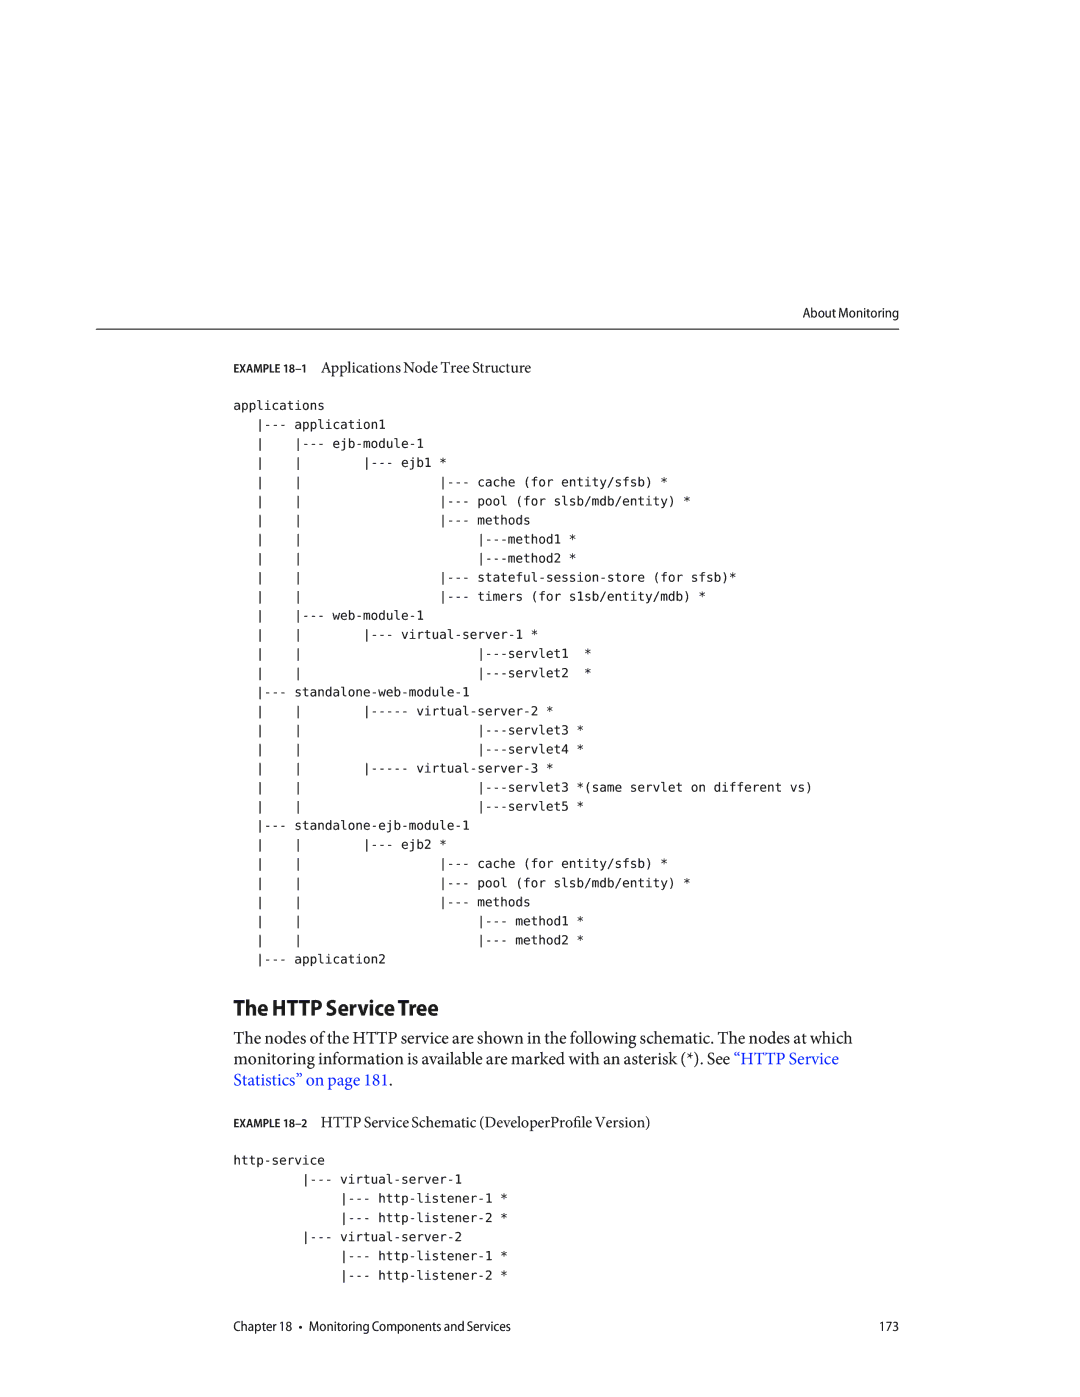
The nodes of the HTTP service are shown in the following schematic. The nodes at which monitoring information is available are marked with an asterisk (*). See “HTTP Service Statistics” on page 181.
EXAMPLE
|
|
| |
| |||
| |||
| |||
| |||
| * | ||
| * | ||
Chapter 18 • Monitoring Components and Services | 173 |