SWRA004A
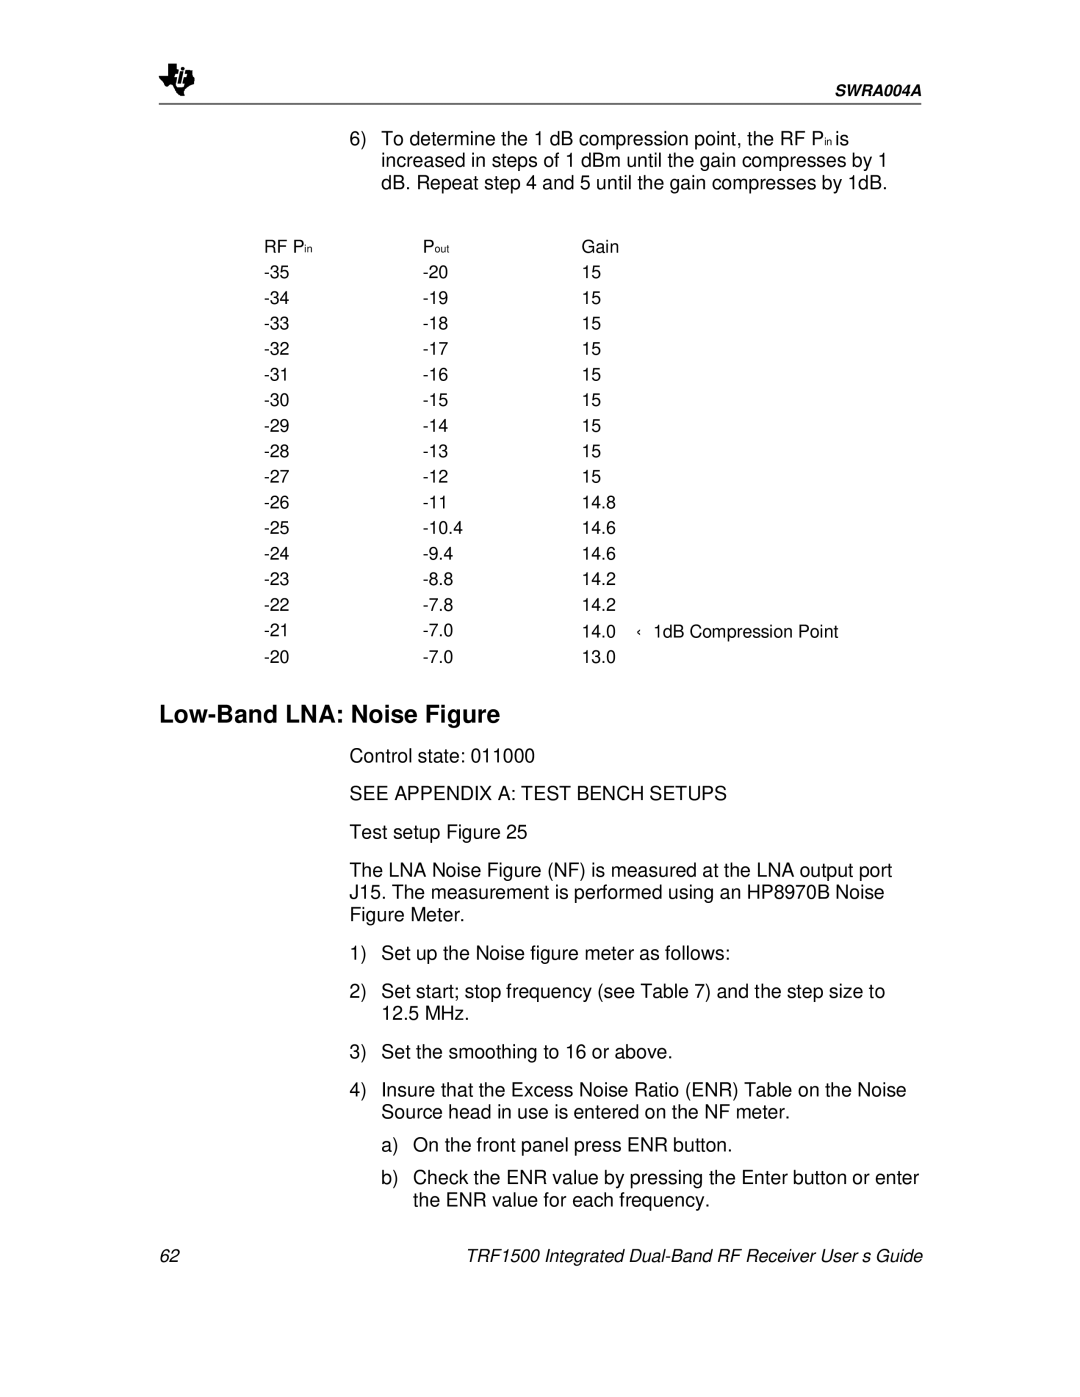
6) To determine the 1 dB compression point, the RF Pin is increased in steps of 1 dBm until the gain compresses by 1 dB. Repeat step 4 and 5 until the gain compresses by 1dB.
RF Pin | Pout | Gain |
15 | ||
15 | ||
15 | ||
15 | ||
15 | ||
15 | ||
15 | ||
15 | ||
15 | ||
14.8 | ||
14.6 | ||
14.6 | ||
14.2 | ||
14.2 | ||
14.0 ←1dB Compression Point | ||
13.0 |
Low-Band LNA: Noise Figure
Control state: 011000
SEE APPENDIX A: TEST BENCH SETUPS
Test setup Figure 25
The LNA Noise Figure (NF) is measured at the LNA output port
J15. The measurement is performed using an HP8970B Noise
Figure Meter.
1)Set up the Noise figure meter as follows:
2)Set start; stop frequency (see Table 7) and the step size to 12.5 MHz.
3)Set the smoothing to 16 or above.
4)Insure that the Excess Noise Ratio (ENR) Table on the Noise Source head in use is entered on the NF meter.
a)On the front panel press ENR button.
b)Check the ENR value by pressing the Enter button or enter the ENR value for each frequency.
62 | TRF1500 Integrated |