Volume 9: Managing the Blue Coat SG Appliance
Viewing Traffic Distribution Statistics
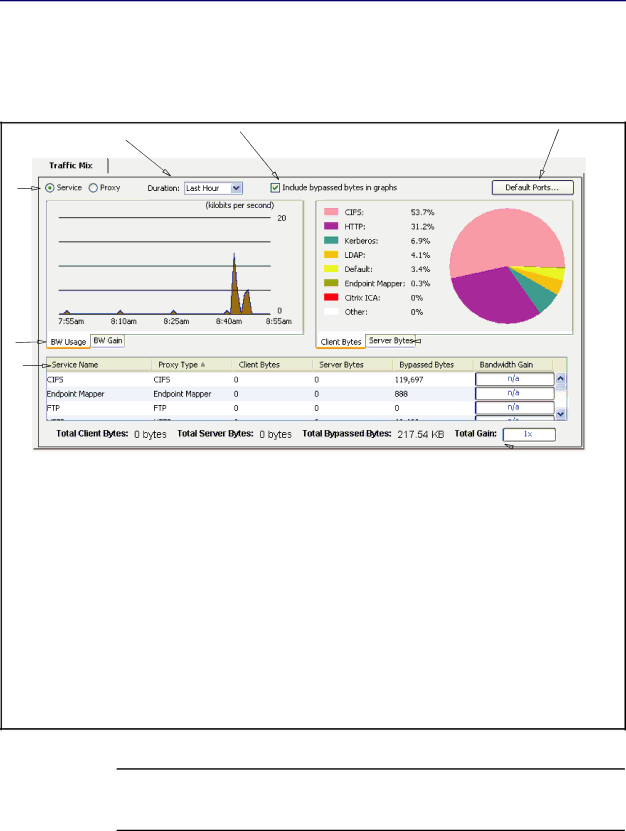
Use the Statistics > Traffic Mix page to display traffic distribution and bandwidth statistics for traffic running through the SG appliance. You can display statistics for proxy types, or for services, and for various time periods.
g | h | e |
|
|
f
a | b | |
|
|
|
c
![]() d
d
Key:
a.View aggregated bandwidth usage or gain graphs and statistics.
b.View client or server
c.Review client bytes, server bytes, bypassed bytes, and bandwidth gain (per proxy or service).
d.Review totals for client bytes, server bytes, bandwidth gain, bypassed bytes, and total gain (for all proxies or all services).
e.Show default service bytes per port.
f.Switch between proxy and service traffic mix statistics.
g.Modify the historical reporting period.
h.Include or exclude bypassed bytes.
Figure 5-2. Traffic Mix Page
Note: Bypassed bytes are bytes that are not intercepted by a service or proxy. When you include or exclude bypassed bytes, only the graph data and totals are affected. The table data in the lower half of the page is not altered.
For a list of supported proxies, see “Supported Proxy Types and Services” on page 66.
62