8e6 Enterprise Reporter
Page
8E6 Enterprise Reporter 3.0 USER’S Guide
Contents
Server Menu
Lient U SER S Ection
108
137
174
Ndex
Operations
Enterprise Reporter 3.0 Overview
Hardware
Components
Software
Client Workstation Requirements
Environment
Network Requirements
How to Use this Manual
Organization
Conventions
Following icons are used throughout this User’s Guide
Terminology
Overview
Save As window, popup windows, or login windows
Introduction
Preliminary Network Settings
Accessing the Server
Procedures for Accessing the Server
Log On
Procedures for Logging On, Off the Server
Logging on the First Time
Administrator GUI, main screen, first-time access
Specify the Server’s function
Set up an Administrator Login ID
Add/Edit/Delete Administrators screen
Select New Administrators from the pull-down menu
Log Off
Configuring the ER 3.0 Server
Administrator GUI
Network Menu
Network menu, main screen
Live Mode
Box Mode
Archive Mode
Change the Box Mode
Change Box Mode
Add/Edit/Delete Administrators screen
Add an Administrator
View a List of Administrators
Edit an Administrator’s Login ID
Network Settings screen
Delete an Administrator
Set up/Edit IPAddresses
Enter or edit an IP address in each appropriate field
Routing Table screen
View a List of Routers
Add a Router
Delete a Router
Time Settings screen
Specify the Time Zone
Specify Network Time Protocol Servers
Click the Save button to save your entries
Network Diagnostics screen
Update the Time on the Server
Ping
Ping results
Trace Route
10 Trace Route results
Backup screen
Server Menu
Backup Procedures
12 Backup screen
Set up/Edit External Backup FTP Password
Execute a Manual Backup
Perform a Remote Backup
Perform a Restoration to the ER 3.0 Server
Self Monitoring screen
13 Self Monitoring screen
Set up andActivate Self-Monitoring
View a List of Contact E-Mail Addresses
Remove Recipient from E-mail Notification List
Deactivate Self-Monitoring
Server Status screen
View the Status of the Server
Secure Access screen
15 Secure Access screen
Activate a Port to Access the Server
Terminate a Port Connection
Software Update screen
Terminate All Port Connections
Install a Patch
View Installed Patches
Retrieve a Patch
18 Software Updates for the ER
Shut Down screen
Server Action Selections
Perform a Server Action
Database Menu
User Name Identification screen
21 User Name Indentification screen with IP.ID activated
Administrator Section Configuring the ER 3.0 Server
Configure the Server to Log User Activity
View the User Name Identification screen
Identification Timeout
Static IPAssignment
View Elapsed Time screen
Deactivate User Name Identification
Establish the Unit of Elapsed Time for Page Views
Elapsed Time Rules
Tools screen
23 Tools screen
View Diagnostic Reports
View Database Status Logs
Change Database Password
Expiration screen
24 Expiration screen
Expiration Screen Terminology
Expiration Rules
View Data Storage Statistics
Administrator Section Configuring the ER 3.0 Server
Administrator Section Configuring the ER 3.0 Server
Change Data Storage Settings
Administrator Section Configuring the ER 3.0 Server
Client User Section
Workstation Configuration
Installation Components
Install the Odbc Driver
Odbc folder
Click Continue to open the Install Drivers dialog box
Data Sources dialog box
Install Microsoft Access Runtime
Microsoft Access Runtime dialog box
Installation Location dialog box
Download and Install the Client
Download the Client
10 Upgrades/Tools page, Enterprise Reporter 3.0 circled
Install the Client
11 Warning dialog box
13 Installation Wizard
Click Next to install the Client application on your machine
17 Automatic Report Setup
18 Installation complete
Update the Server Address and Password
19 Login window with unchanged Server address
20 Admin Form popup box
Client User Section Workstation Configuration
Uninstall the Client, Install New Release
22 Information alert box
23 Confirmation dialog box
Login window
Accessing the Client
Launch the Client Application
Administrator Details
Change the Administrator Password
Changing Admin Password box
View, Modify Server Information
Server and Odbc Information box
Client User Section Accessing the Client
Log
Date Scopes
Server Statistics
100
Expiration Info
ER Activity
Hits Per Day chart
102
Hits Per Week chart
11 Client application main menu
104
12 Settings box menu
Navigate the Main Menu
Icons
Buttons
106
Log Out
Customizing the Client
Settings
108
Event Schedule
Scheduled Events box
View Details for a Scheduled Event
View Details or Edit a Scheduled Event
110
Edit a Scheduled Event
Day of the Week
Schedule an Event
112
Category Descriptions
Delete a Scheduled Event
View Details for a Filter Category
Update a Filter Category
114
Add a Filter Category
Add a Filter Category
Category Groupings
116
Add a Category Group
Group Information frame
Rename a Category Group
Delete a Category Group
118
Group Definitions frame
Add Categories to a Category Group
Delete a Category from a Category Group
120
11 User Group Setup box
User Groupings
Rename a User Group
Add a User Group
122
Delete a User Group
View a List of Users in a User Group
Define a User Group
124
14 Add Users to group
126
Delete a User
Add User
User Permissions
128
16 Add User
User Information frame
Add User to a User Group
Remove User from a User Group
130
Update User Group by Adding a User
Edit Password or Delete User
Update User Group by Removing a User
Change a User’s Password
132
18 Settings menu, non-administrator user
My Account
View Users in a User Group
134
Change Password
20 Change User Password
Set New Defaults
Default Options
136
Using the Client
Specific Search Function
Specify Time Frame for the Search
138
Specify Type of Search to be Performed
Specify Items to be Searched, View Results
Object Search
Search
140
View Additional Information
Report Screen Elements
142
Date Scope
Date Scope field
Entries for Monthly option
144
Display button
Display Information box
Navigation path
Search button
146
Back icon
Navigation bar
Categories icon
IPs icon
Users icon
Sites icon
Category Groups icon
Reports / Report Layout field
Exit icon
Save icon
View icon
150
View, Print the Report
Double Break Information dialog box
152
Generate Chart box
13 Generate Chart box
Mail icon
Print icon
154
Click the E-mailbutton to open the Output Format box
Export icon
156
Record icon
Save Custom Report dialog box
158
159
Save as Custom Report dialog box
160
161
Open a Recorded Report
162
TIP Click Cancel to close this dialog box
Columns
Filters
164
165
166
Select All, Deselect All buttons
To include all records, click the Select All button
Records
168
Generate a Report
Report Formats
170
Standard report
23 Standard report format
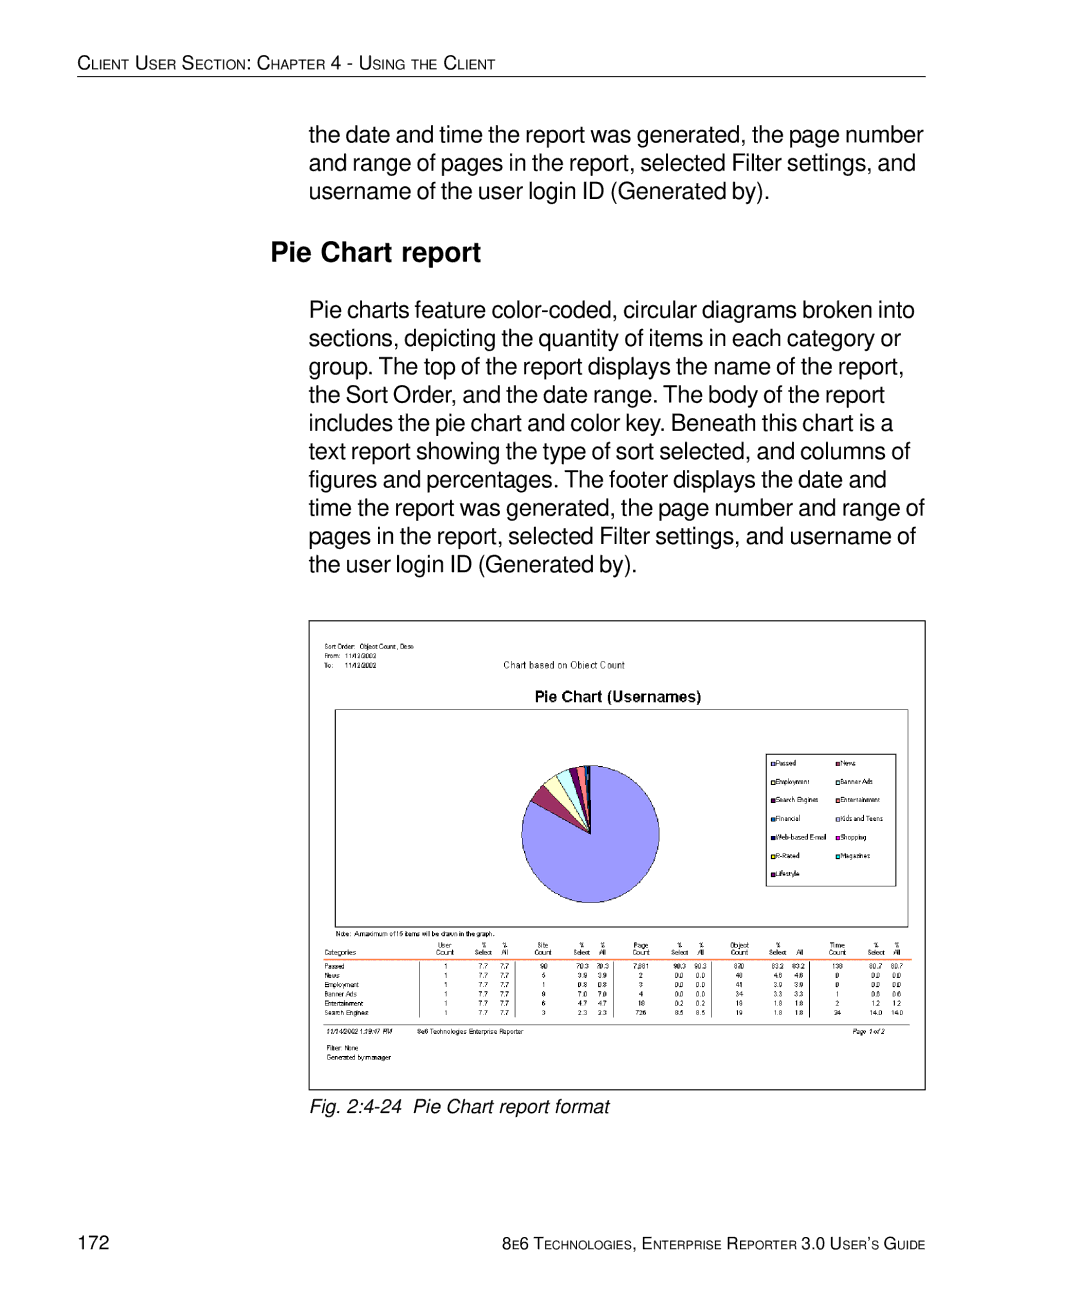
Pie Chart report
172
Bar Chart report
25 Bar Chart report format
Reports
Categories Reports
Categories
174
Category/IPs
Category/IPs report
Category/Users
176
Category/Sites
Category/Sites report
IPs
IPs Reports
178
IP/Categories
IP/Categories report
IP/Users
180
IP/Sites
IP/Sites report
Users
Users Reports
182
User/Categories
10 User/Categories report
User/IPs
184
User/Sites
12 User/Sites report
Sites
Sites Reports
186
Site/Categories
14 Site/Categories report
Site/IPs
188
Site/Users
16 Site/Users report
User Groups Report
Category Groups Report
190
Page/Object Reports
18 Objects report screen
19 Objects report
192
Technical Support
Hours
Contact Information
Domestic United States
Support Procedures
Mail
Address
194
Standard Warranty
Product Warranties
Technical Support and Service
196
Extended Warranty optional
Extended Technical Support and Service
Appendix a
Scheduled Task Wizard
Steps for Scheduling a Task
198
Choose Scheduled Tasks to open the Scheduled Tasks window
Scheduled Task Wizard, 1st frame
200
Scheduled Task Wizard, 3rd frame
Scheduled Task Wizard, 5th frame
202
Dialog box, Task tab
11 Set Account Info box
204
Appendix B
Lotus Notes Configuration
Steps for Former MS Outlook / Express Users
Steps for Installing and Configuring Lotus Notes
Install Lotus Notes
Configure Microsoft Mail Client
Verify Internet Explorer Settings
Index
208
209
210
211
212
213
214
215