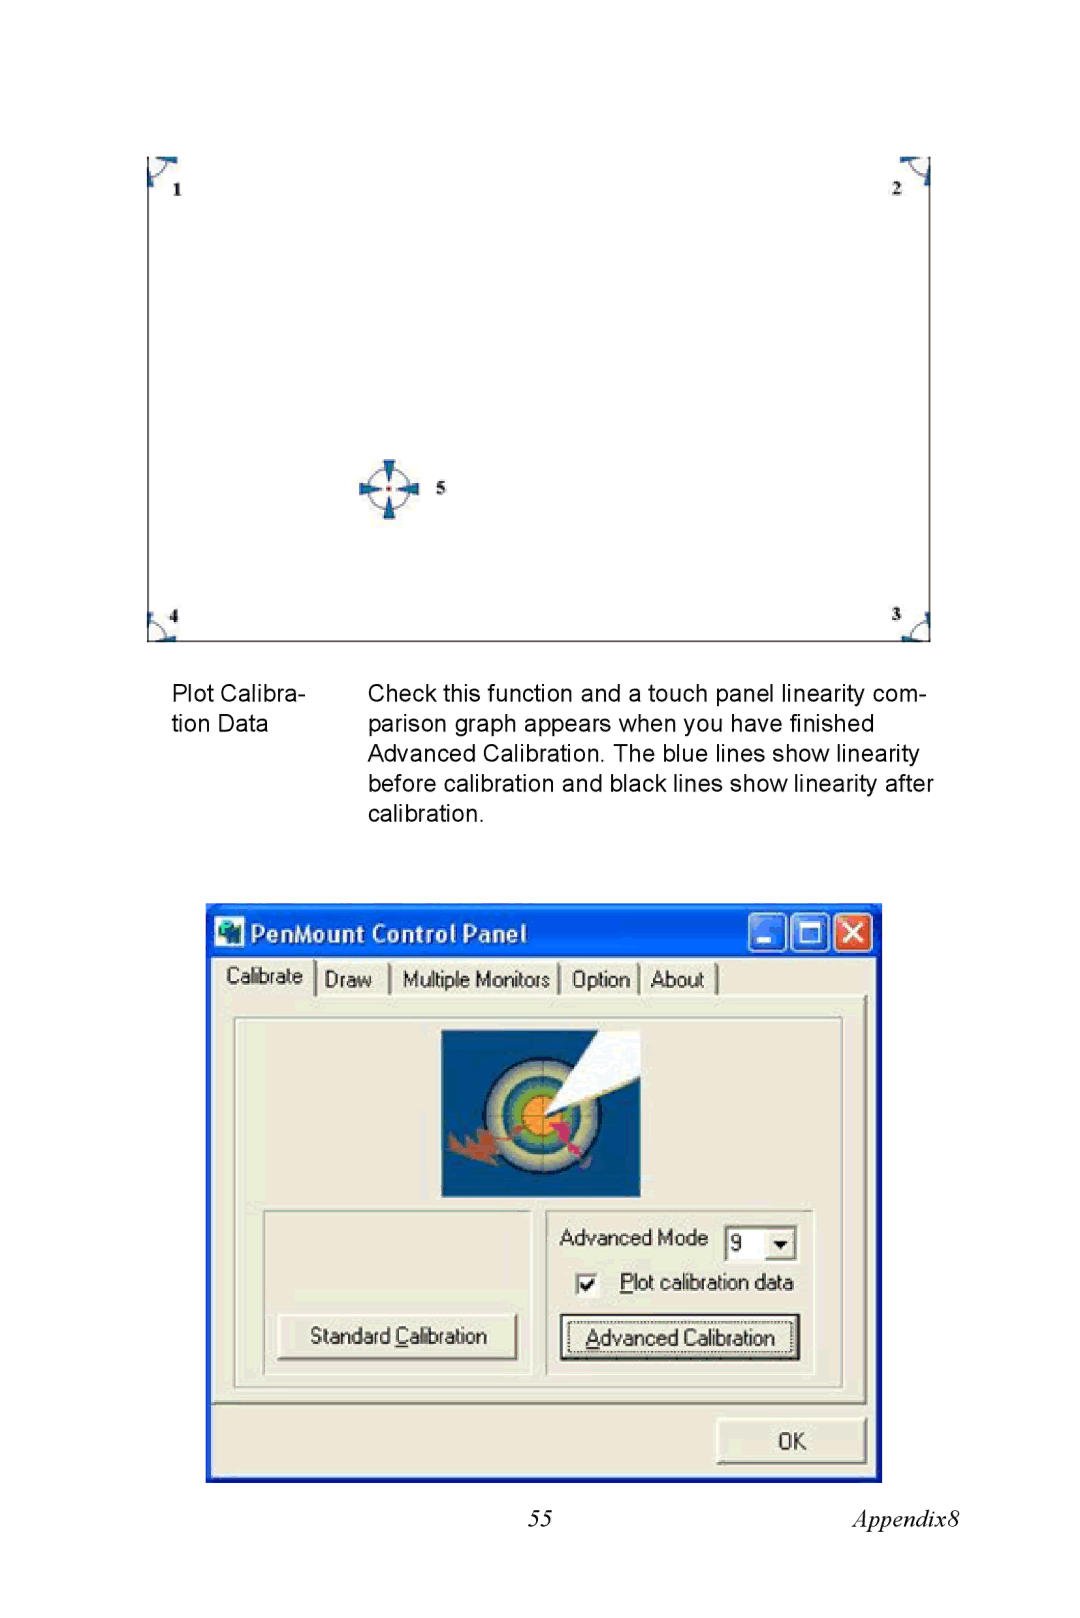
Plot Calibra- Check this function and a touch panel linearity com-
tion Data parison graph appears when you have finished Advanced Calibration. The blue lines show linearity before calibration and black lines show linearity after calibration.
55 | Appendix8 |