5.0 Operation
5.2 Output Power bar graph
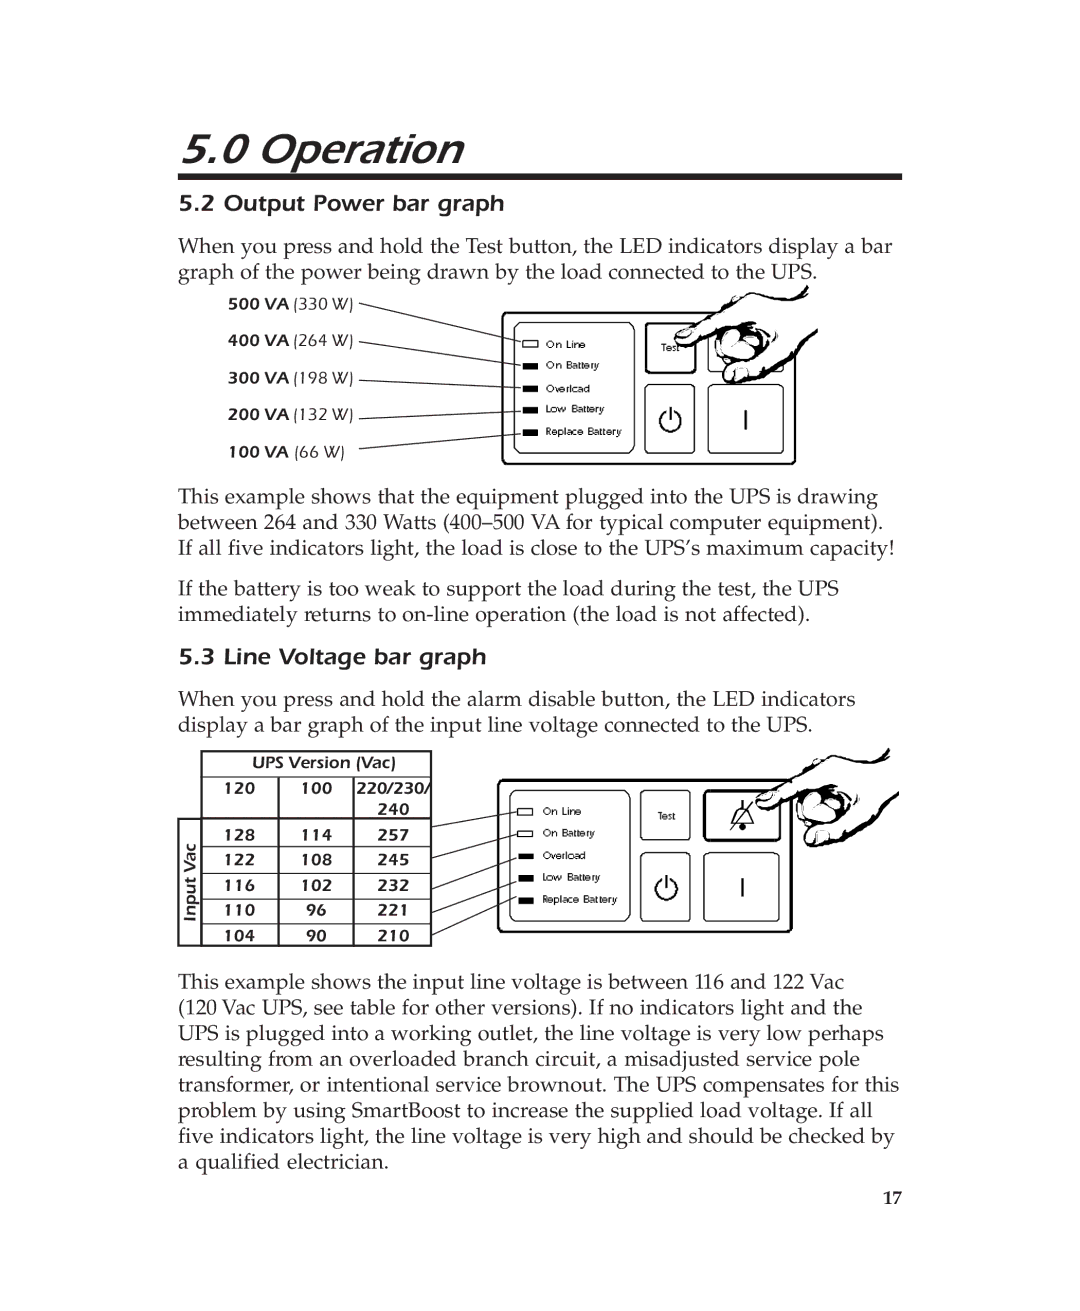
When you press and hold the Test button, the LED indicators display a bar graph of the power being drawn by the load connected to the UPS.
500 VA (330 W)
400 VA (264 W)
300 VA (198 W)
200 VA (132 W)
100 VA (66 W)
This example shows that the equipment plugged into the UPS is drawing between 264 and 330 Watts
If the battery is too weak to support the load during the test, the UPS immediately returns to
5.3 Line Voltage bar graph
When you press and hold the alarm disable button, the LED indicators display a bar graph of the input line voltage connected to the UPS.
Input Vac![]()
UPS Version (Vac)
120100 220/230/
240
128 | 114 | 257 |
122 | 108 | 245 |
116 | 102 | 232 |
110 | 96 | 221 |
104 | 90 | 210 |
This example shows the input line voltage is between 116 and 122 Vac
(120 Vac UPS, see table for other versions). If no indicators light and the UPS is plugged into a working outlet, the line voltage is very low perhaps resulting from an overloaded branch circuit, a misadjusted service pole transformer, or intentional service brownout. The UPS compensates for this problem by using SmartBoost to increase the supplied load voltage. If all five indicators light, the line voltage is very high and should be checked by a qualified electrician.
17