Chapter 3 Monitor
Generating Reports Using Monitor
Note For a complete explanation of available data views and report types, see Understanding Data Views, page
Monitor Parameters Pane
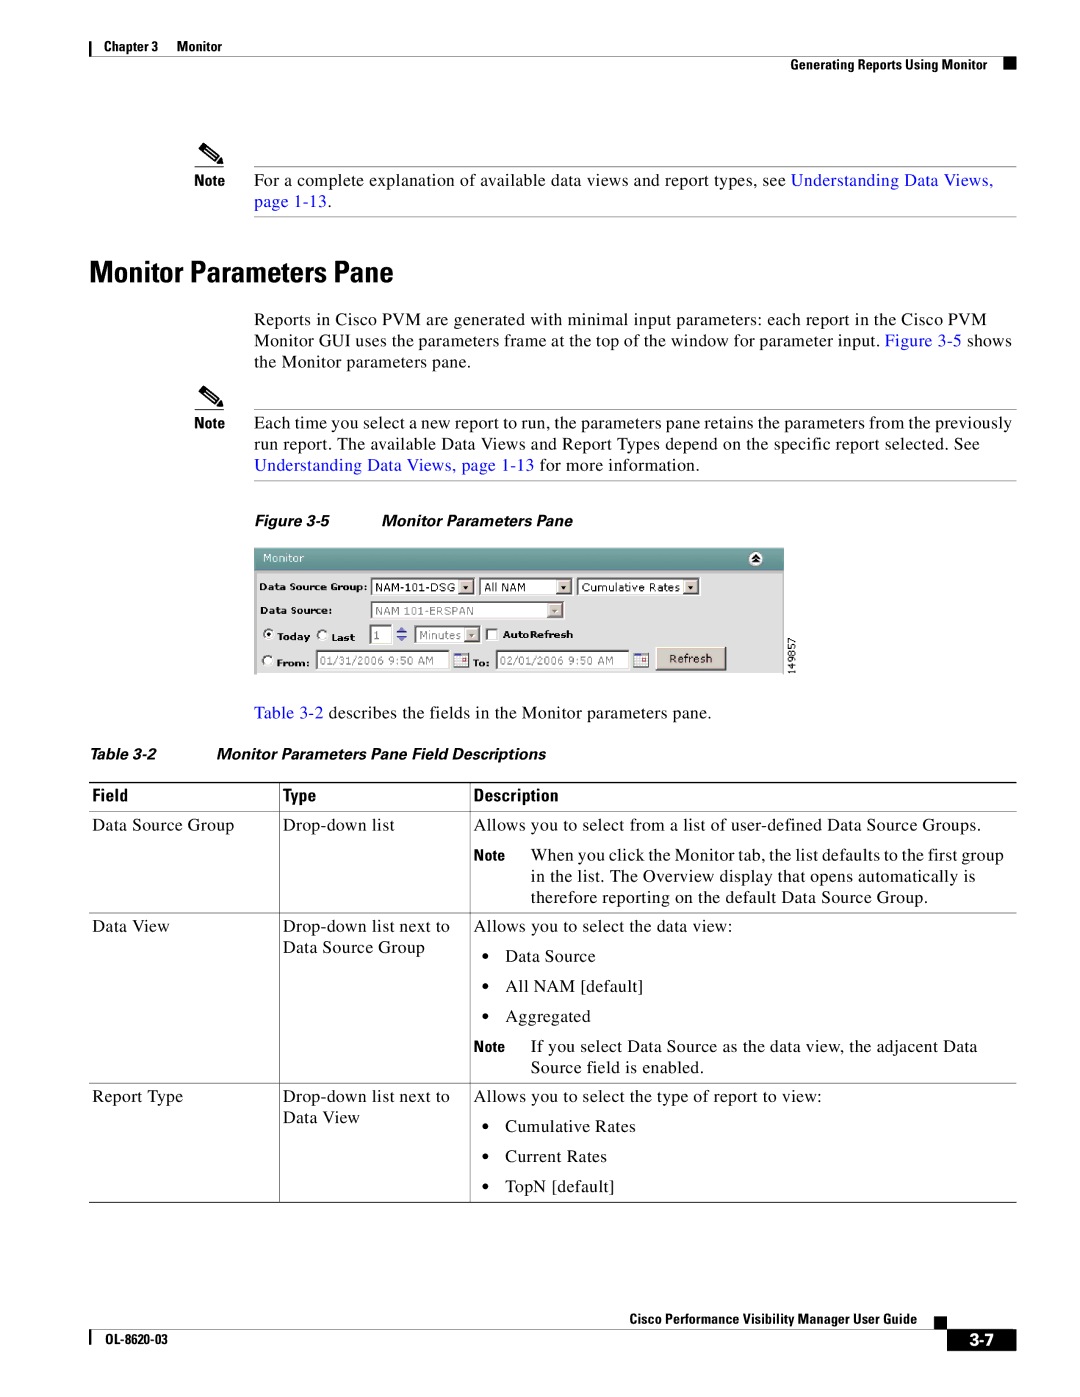
Reports in Cisco PVM are generated with minimal input parameters: each report in the Cisco PVM Monitor GUI uses the parameters frame at the top of the window for parameter input. Figure
Note Each time you select a new report to run, the parameters pane retains the parameters from the previously run report. The available Data Views and Report Types depend on the specific report selected. See Understanding Data Views, page
Figure 3-5 Monitor Parameters Pane
Table
Table | Monitor Parameters Pane Field Descriptions | |||
|
|
|
| |
Field |
| Type | Description | |
|
|
| ||
Data Source Group | Allows you to select from a list of | |||
|
|
| Note When you click the Monitor tab, the list defaults to the first group | |
|
|
|
| in the list. The Overview display that opens automatically is |
|
|
|
| therefore reporting on the default Data Source Group. |
|
|
|
| |
Data View |
| Allows you to select the data view: | ||
|
| Data Source Group | • | Data Source |
|
|
| ||
|
|
| • | All NAM [default] |
|
|
| • | Aggregated |
|
|
| Note If you select Data Source as the data view, the adjacent Data | |
|
|
|
| Source field is enabled. |
|
|
|
| |
Report Type |
| Allows you to select the type of report to view: | ||
|
| Data View | • | Cumulative Rates |
|
|
| ||
|
|
| • | Current Rates |
|
|
| • | TopN [default] |
|
|
|
|
|
Cisco Performance Visibility Manager User Guide
|
| ||
|
|
