Chapter 3 Monitor
Generating Reports Using Monitor
Table | Monitor Parameters Pane Field Descriptions (continued) | ||
|
|
|
|
Data Source |
| Allows you to select the specific data source for the report if the Data | |
|
| Data View | Source view has been selected. |
|
|
| Note The list defaults to the first data source available in the list for the |
|
|
| NAM or switch selected in the Data Source Group list. |
|
|
|
|
Today |
| Radio button | Runs the report for all data collected since midnight. [default] |
|
|
|
|
Last |
| Radio button | Runs the report for the last n hours or minutes. |
|
|
| Note The historical limit for reporting is the last seven days, but to run |
|
|
| reports going back greater than 24 hours, it is easier to use the |
|
|
| From/To fields. |
|
|
|
|
Auto Refresh |
| Check box | Refreshes the displayed report at the interval selected in the Last option. |
|
|
|
|
From / To |
| Radio button with | Allows selection of a specific set of dates using the calendar icons to |
|
| open the | |
|
|
| Note Reports can be run for up to the last seven days. |
|
|
|
|
Refresh |
| Button | Refreshes the displayed report based on the selected parameters. |
|
|
| |
Expand/Collapse | Icon | Expands or collapses the Monitor parameters pane. | |
|
|
|
|
Running a Report
The following procedure uses the Applications report as an example. For samples and descriptions of individual reports, see the Appendix B, “Report Samples for Monitor and Reports.” appendix. For a complete explanation of available data views and report types, see Understanding Data Views, page
Step 1 Log in to Cisco PVM.
The Overview report runs automatically and appears in the Monitor display pane.
Step 2 Select a report to run by
a.clicking a suite name in the navigation menu and
b.selecting the report name from the suite list.
The selected report automatically runs based on the parameters used in the previously run report.
Step 3 Expand the parameters pane by clicking the expansion icon at the right of the Monitor window header. T
The report parameters pane appears.
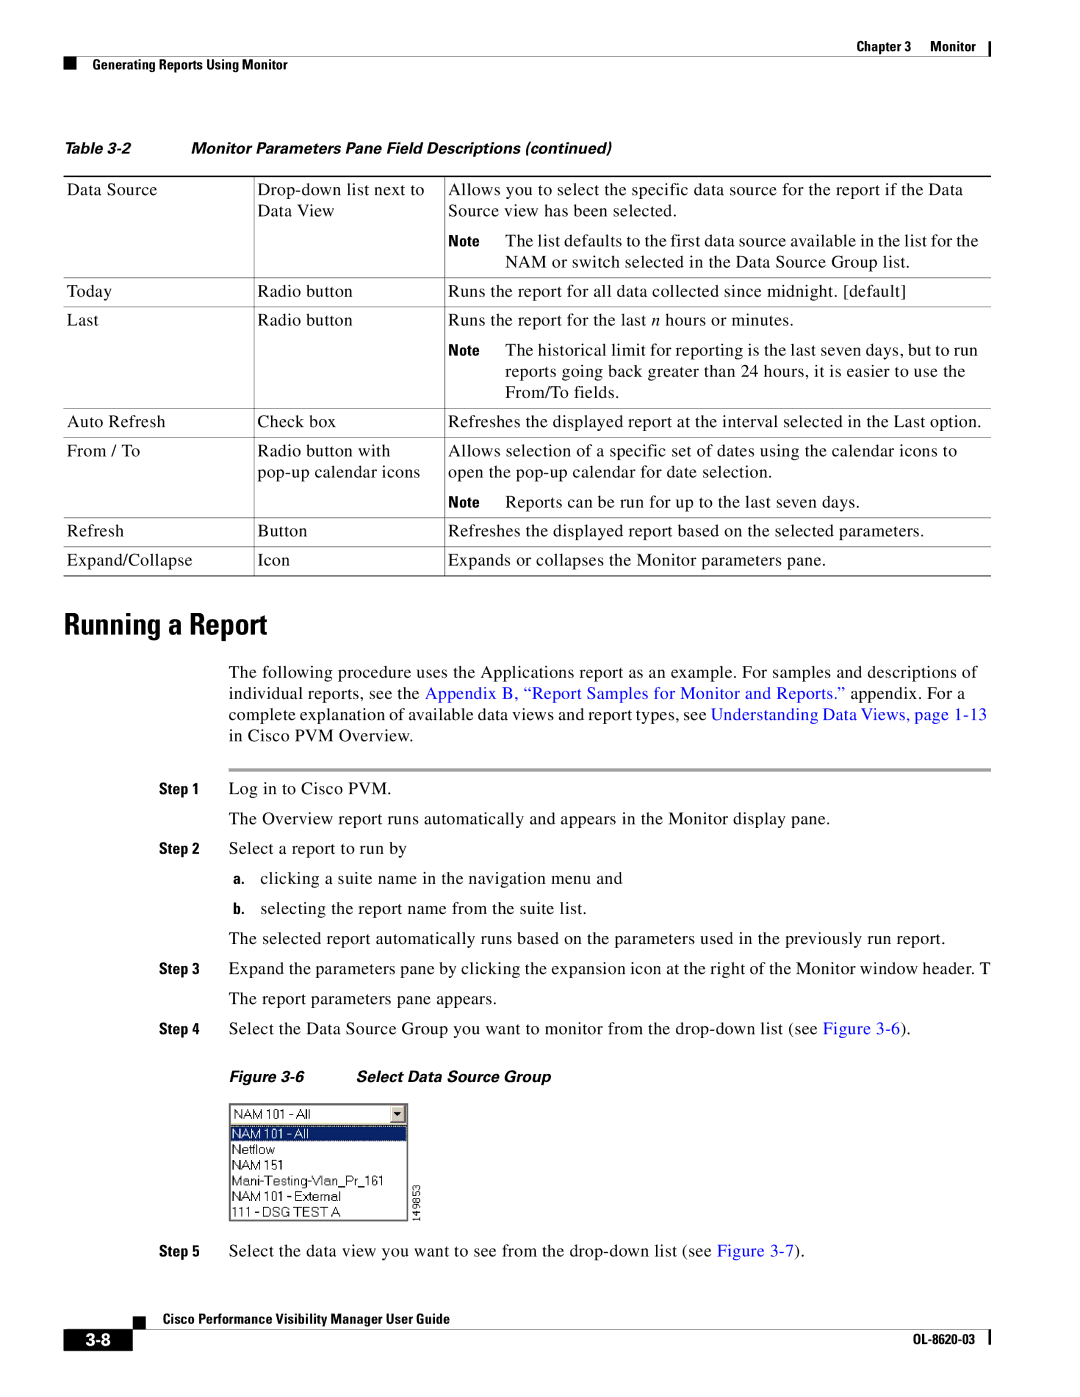
Step 4 Select the Data Source Group you want to monitor from the
Figure 3-6 Select Data Source Group
Step 5 Select the data view you want to see from the
Cisco Performance Visibility Manager User Guide
| ||
|
