Chapter 3 Monitor
Generating Reports Using Monitor
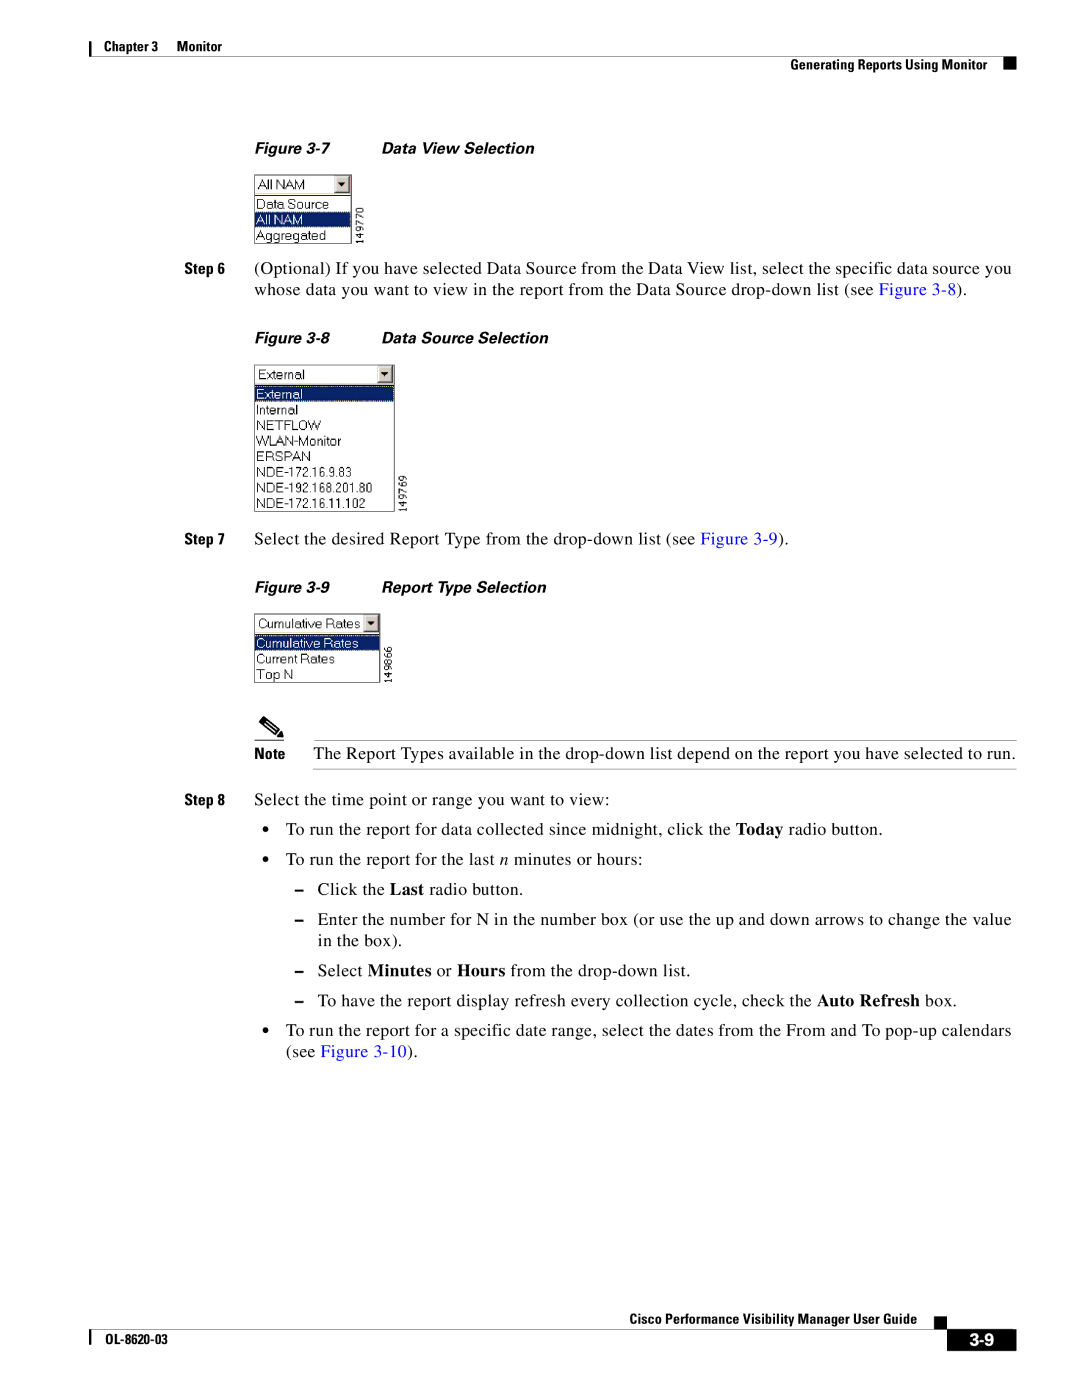
Figure 3-7 Data View Selection
Step 6 (Optional) If you have selected Data Source from the Data View list, select the specific data source you whose data you want to view in the report from the Data Source
Figure 3-8 Data Source Selection
Step 7 Select the desired Report Type from the
Figure 3-9 Report Type Selection
Note The Report Types available in the
Step 8 Select the time point or range you want to view:
•To run the report for data collected since midnight, click the Today radio button.
•To run the report for the last n minutes or hours:
–Click the Last radio button.
–Enter the number for N in the number box (or use the up and down arrows to change the value in the box).
–Select Minutes or Hours from the
–To have the report display refresh every collection cycle, check the Auto Refresh box.
•To run the report for a specific date range, select the dates from the From and To
Cisco Performance Visibility Manager User Guide
|
| ||
|
|