Using the
Rate
The count for the selected statistic during the last poll interval. The parameters for Rate are the same as those provided for Raw Counts; for a complete description, see Raw Counts, page
Viewing Interface Detail Statistics
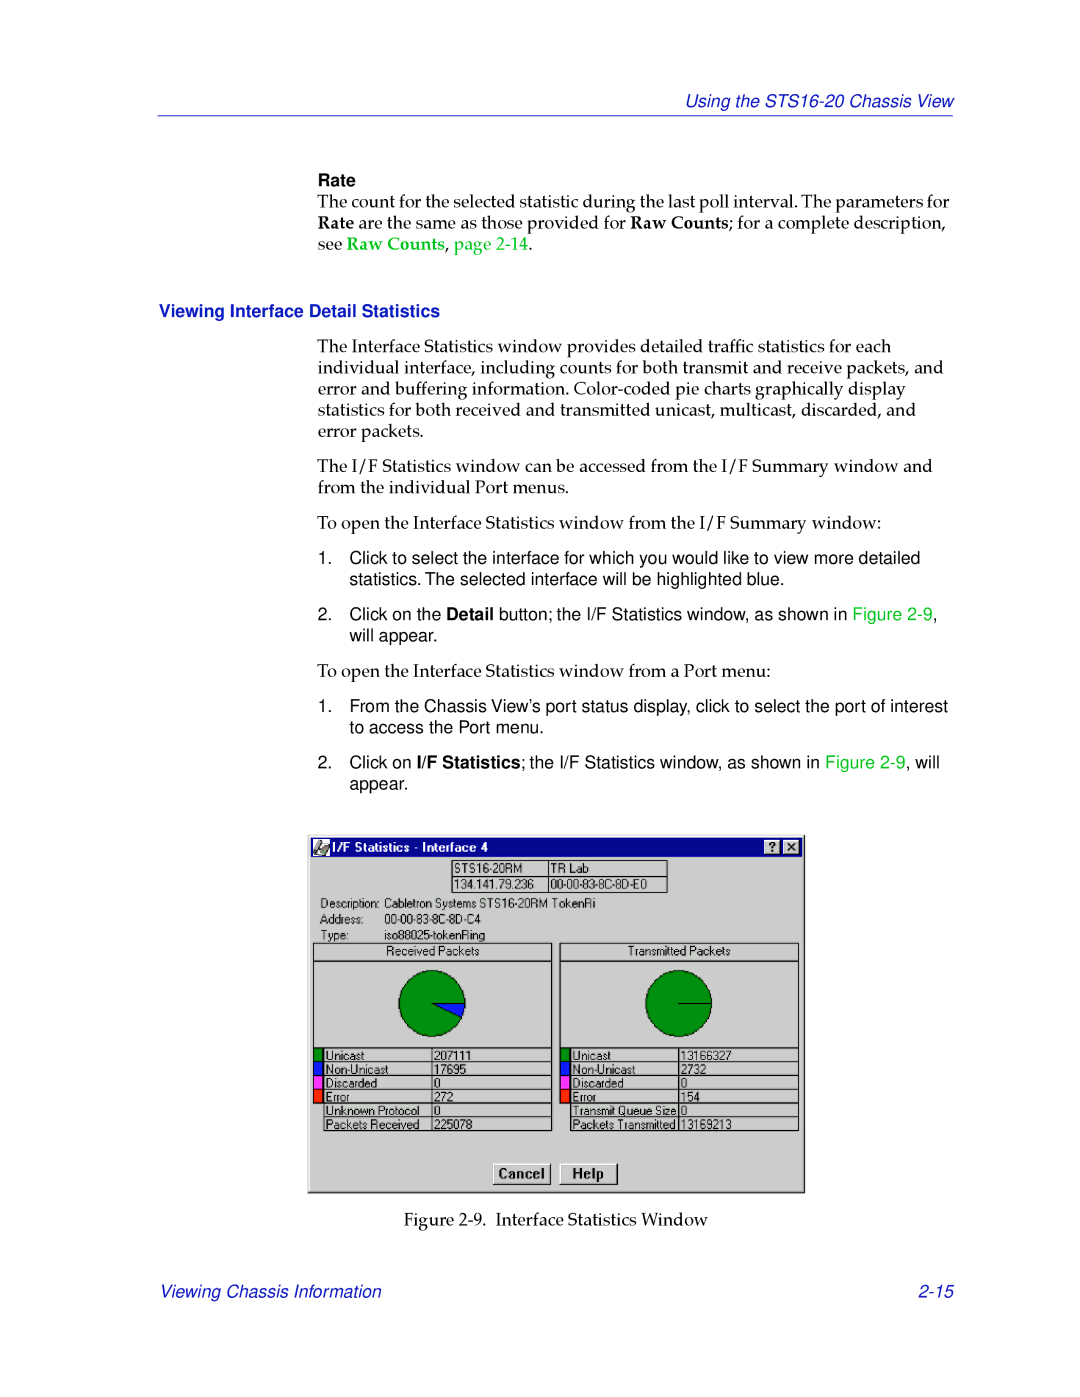
The Interface Statistics window provides detailed trafÞc statistics for each individual interface, including counts for both transmit and receive packets, and error and buffering information.
The I/F Statistics window can be accessed from the I/F Summary window and from the individual Port menus.
To open the Interface Statistics window from the I/F Summary window:
1.Click to select the interface for which you would like to view more detailed statistics. The selected interface will be highlighted blue.
2.Click on the Detail button; the I/F Statistics window, as shown in Figure
To open the Interface Statistics window from a Port menu:
1.From the Chassis View’s port status display, click to select the port of interest to access the Port menu.
2.Click on I/F Statistics; the I/F Statistics window, as shown in Figure
Figure 2-9. Interface Statistics Window
Viewing Chassis Information |