Using the
Viewing I/F Summary Information
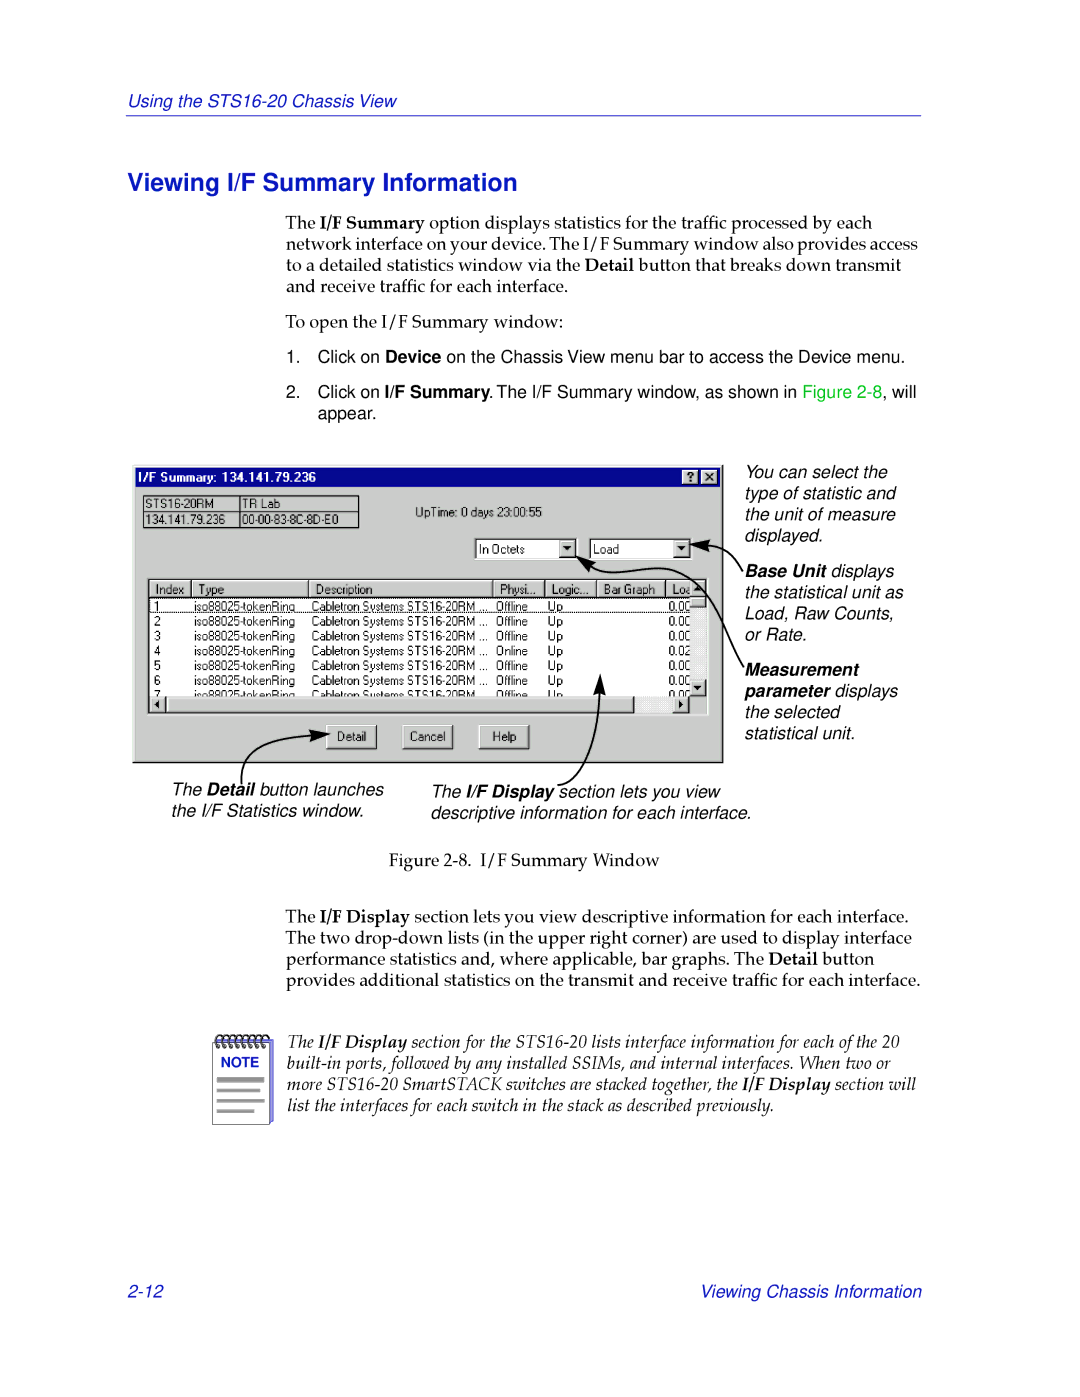
The I/F Summary option displays statistics for the trafÞc processed by each network interface on your device. The I/F Summary window also provides access to a detailed statistics window via the Detail button that breaks down transmit and receive trafÞc for each interface.
To open the I/F Summary window:
1.Click on Device on the Chassis View menu bar to access the Device menu.
2.Click on I/F Summary. The I/F Summary window, as shown in Figure
The Detail button launches the I/F Statistics window.
You can select the type of statistic and the unit of measure displayed.
![]() Base Unit displays the statistical unit as Load, Raw Counts, or Rate.
Base Unit displays the statistical unit as Load, Raw Counts, or Rate.
Measurement parameter displays the selected statistical unit.
The I/F Display section lets you view descriptive information for each interface.
Figure 2-8. I/F Summary Window
The I/F Display section lets you view descriptive information for each interface. The two drop-down lists (in the upper right corner) are used to display interface performance statistics and, where applicable, bar graphs. The Detail button provides additional statistics on the transmit and receive trafÞc for each interface.
NOTE |
The I/F Display section for the
Viewing Chassis Information |
