Section: 3.7 Debugging and profiling

As this feature is limited to tcp communication only, it will not have any effect when using native RDMA drivers such as Infiniband or Myrinet. Note that the combination of tfdr and failover mode is not supported in this version of Scali MPI Connect.

Data errors will be logged using the standard syslog mechanism.

3.7 Debugging and profiling

The complexity of debugging programs can grow dramatically when going from serial to parallel programs. So to assist in debugging MPI programs Scali MPI Connect has a nnumber of features built-in, like starting processes directly in a debugger and tracing proceses’ traffic patterns.

3.7.1 Debugging with a sequential debugger

SMC applications can be debugged using a sequential debugger. By default, the GNU debugger gdb is invoked by mpimon. If another debugger is to be used, specify the debugger using the mpimon option -debugger <debugger>.

To set debug-mode for one or more MPI-processes, specify the MPI-process(es) to debug using the mpimon option -debug <select>. In addition, note that the mpimon option -display <display> should be used to set the display for the xterm terminal emulator. An xterm terminal emulator, and one debugger, is started for each of the MPI-processes being debugged.

For example, to debug an application using the default gdb debugger do:

user% mpimon -debug all <application +parameters> -- <node specification>

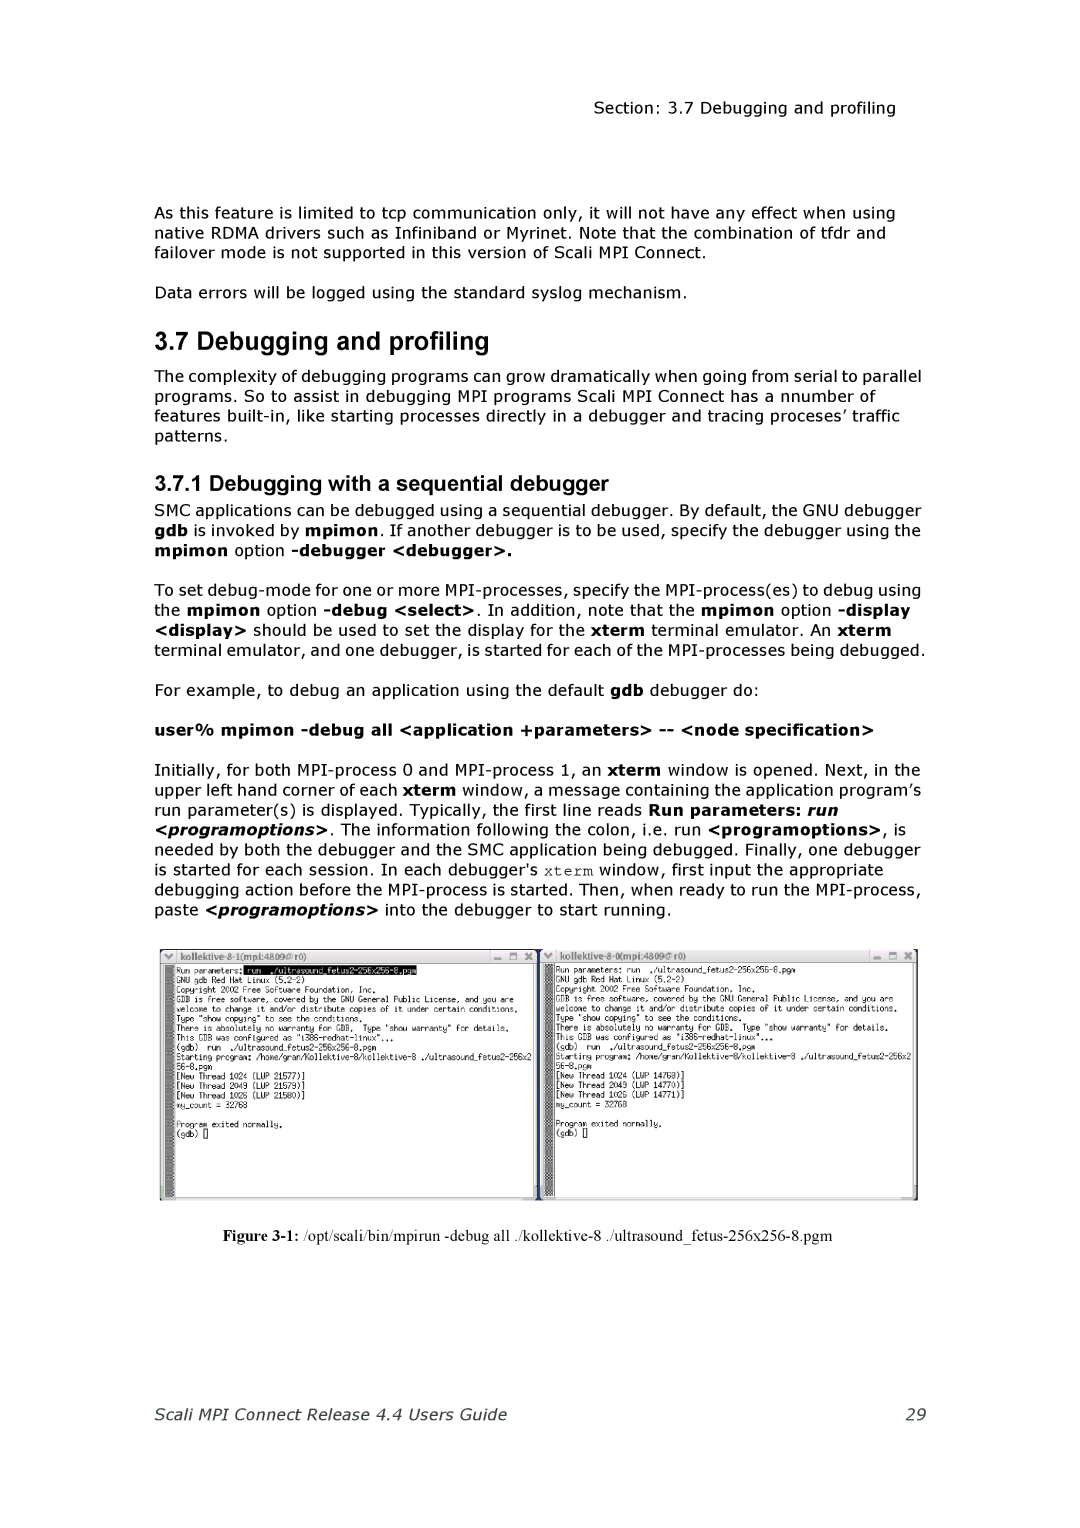
Initially, for both MPI-process 0 and MPI-process 1, an xterm window is opened. Next, in the upper left hand corner of each xterm window, a message containing the application program’s run parameter(s) is displayed. Typically, the first line reads Run parameters: run <programoptions>. The information following the colon, i.e. run <programoptions>, is needed by both the debugger and the SMC application being debugged. Finally, one debugger is started for each session. In each debugger's xterm window, first input the appropriate debugging action before the MPI-process is started. Then, when ready to run the MPI-process, paste <programoptions> into the debugger to start running.

Figure 3-1: /opt/scali/bin/mpirun -debug all ./kollektive-8 ./ultrasound_fetus-256x256-8.pgm

Scali MPI Connect Release 4.4 Users Guide

29

Page 41
Image 41
Escali 4.4 manual Debugging and profiling, Debugging with a sequential debugger