1: MPI_Comm_rank | 1 | 3.1us | 3.1us | 1 | 3.1us | 3.1us |
1: MPI_Comm_size | 1 | 1.5us | 1.5us | 1 | 1.5us | 1.5us |
1: MPI_Gather | 1 | 109.9us | 109.9us | 1 | 109.9us | 109.9us |
1: MPI_Init | 1 | 1.0s | 1.0s | 1 | 1.0s | 1.0s |
1: MPI_Keyval_free | 1 | 1.2us | 1.2us | 1 | 1.2us | 1.2us |
1: MPI_Reduce | 1 | 51.5us | 51.5us | 1 | 51.5us | 51.5us |
1: MPI_Scatter | 1 | 138.7us | 138.7us | 1 | 138.7us | 138.7us |
1: Sum | 9 | 1.0s | 112.8ms | 9 | 1.0s | 112.8ms |
1: Overhead | 0 | 0.0ns |
| 9 | 27.2us | 3.0us |
1:=====================================================================
0:13.26.40
0: Init+0.111598 s | #calls | time | tim/cal | #calls | time | tim/cal |
0: MPI_Bcast | 2 | 79.6us | 39.8us | 2 | 79.6us | 39.8us |
0: MPI_Comm_rank | 1 | 3.3us | 3.3us | 1 | 3.3us | 3.3us |
0: MPI_Comm_size | 1 | 1.4us | 1.4us | 1 | 1.4us | 1.4us |
0: MPI_Gather | 1 | 648.8us | 648.8us | 1 | 648.8us | 648.8us |
0: MPI_Init | 1 | 965.9ms | 965.9ms | 1 | 965.9ms | 965.9ms |
0: MPI_Keyval_free | 1 | 1.1us | 1.1us | 1 | 1.1us | 1.1us |
0: MPI_Reduce | 1 | 37.6ms | 37.6ms | 1 | 37.6ms | 37.6ms |
0: MPI_Scatter | 1 | 258.1us | 258.1us | 1 | 258.1us | 258.1us |
0: Sum | 9 | 1.0s | 111.6ms | 9 | 1.0s | 111.6ms |
0: Overhead | 0 | 0.0ns |
| 9 | 35.6us | 4.0us |
0: =====================================================================
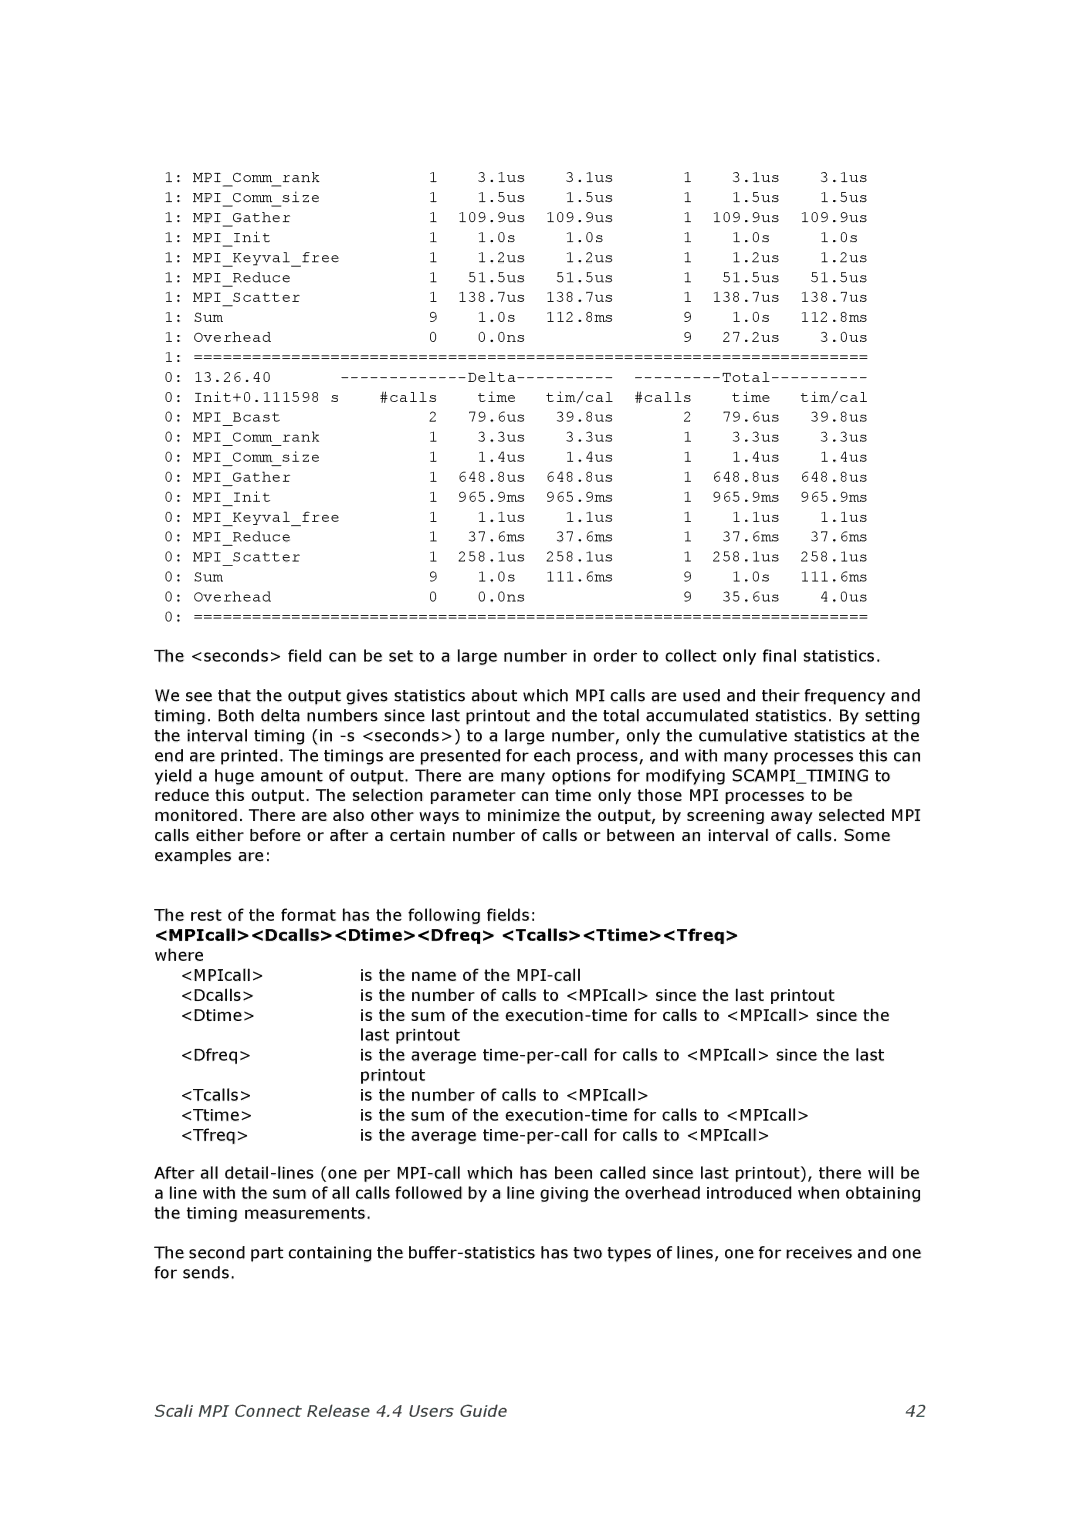
The <seconds> field can be set to a large number in order to collect only final statistics.
We see that the output gives statistics about which MPI calls are used and their frequency and timing. Both delta numbers since last printout and the total accumulated statistics. By setting the interval timing (in
The rest of the format has the following fields:
<MPIcall><Dcalls><Dtime><Dfreq> <Tcalls><Ttime><Tfreq>
where |
|
<MPIcall> | is the name of the |
<Dcalls> | is the number of calls to <MPIcall> since the last printout |
<Dtime> | is the sum of the |
| last printout |
<Dfreq> | is the average |
| printout |
<Tcalls> | is the number of calls to <MPIcall> |
<Ttime> | is the sum of the |
<Tfreq> | is the average |
After all
The second part containing the
Scali MPI Connect Release 4.4 Users Guide | 42 |