Color DGPS/PLOTTER/SOUNDER Color GPS/PLOTTER/SOUNDER
199
About the TFT LCD
Do not open the equipment
Do not disassemble or modify the equipment
Do not operate the equipment with wet hands
Table of Contents
Specifications
Sounder Setup Options
Declaration of Conformity
Iii
Foreword
Features
Word to GP-1650DF/1650F Owners
System Configuration
Display Unit
This page is intentionally left blank
Operational Overview
Display Unit Controls
Inserting Mini Chart Card
Turning the Power On/Off
Turning the power off
Display abbreviations
Plotter Displays
Adjusting Tone and Brilliance
Selecting a display
Sounder Displays
Menu Operation, Soft Keys
Plotter/Sounder Display
Normal Sounder Display
10 Demo setting screen
Demonstration Display
This page is intentionally left blank
Video Sounder Operation
Principle of Operation
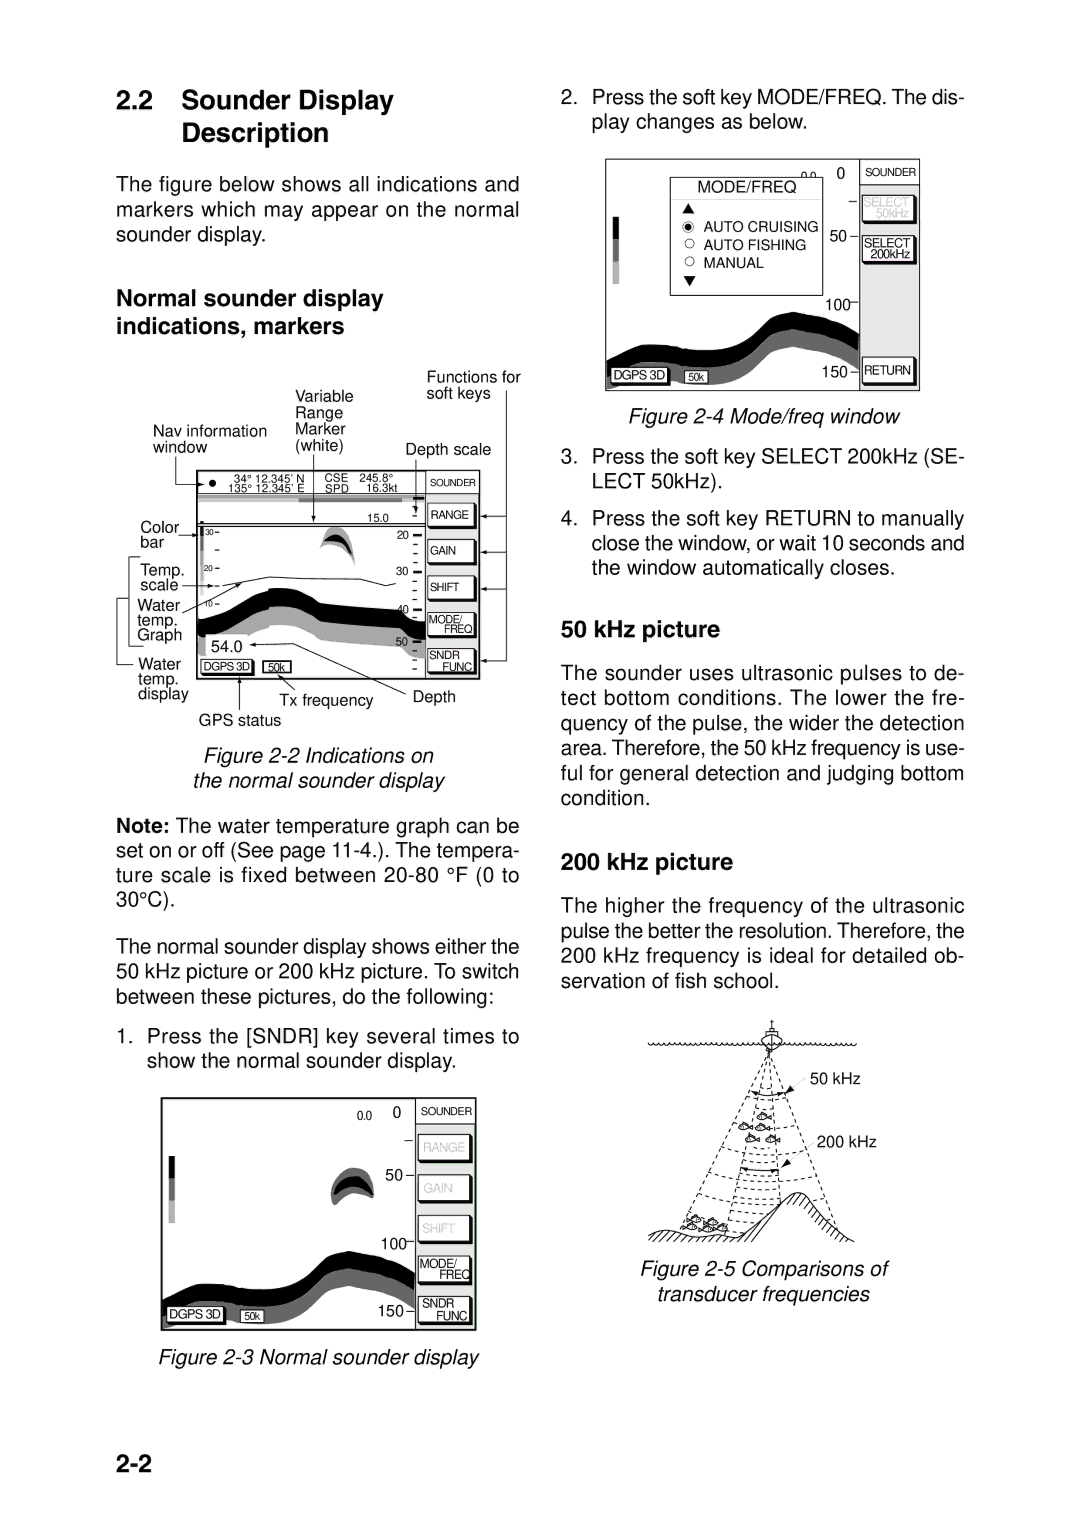
Normal sounder display indications, markers
Sounder Display Description
KHz picture
Selecting sounder display mode
Bottom-zoom display
Marker zoom display
Bottom-lock display
Plotter/Sounder Display
Dual-frequency Display
Scope display
Enter
Automatic Sounder Operation
Manual Sounder Operation
Adjusting the gain
Measuring Depth
Selecting display range
Range shifting
Suppressing Interference
Suppressing Low Level Noise
Erasing Weak Echoes
White Marker
Selecting Background and Echo Colors
Selecting Picture Advance Speed
Background and echo colors
Alarms
Interpreting the Display
Zero line
Fish school echoes
Bottom echo
Surface noise/Aeration
34 Surface noise/aeration
Plotter Displays
Presentation Modes
North-up
Course-up
Selecting Chart Scale/Range
Mini Chart Cards
Cursor
Shifting the Display
Indices and chart enlargement
Remarks on chart display
Chart symbols
Furuno mini chart card
Comparison of Furuno and Nav-Charts chart cards
Port service icons Nav-Charts cards
Aid to navigation data
Enlarging an indication
Navigation Data Display
GPS satellite monitor display
Steering Display
How to read the compass display
Beacon information display
Setting the range of the XTE scale
How to read the XTE scale
Highway Display
Changing Operation Mode
Fifure 3-16 Display setup1 menu
Navigation Trip Distance
Fishing
Displaying Track
Track
Tracking
Stopping/Restarting Plotting of Track
Changing Track Color
Track Plotting Method, Interval
Track plotting method
Track plotting interval
Changing Track Memory Capacity
Track Memory
Erasing All Track
Entering Marks
Mark
Plotter display
Video sounder display
Changing Mark Attributes
Video sounder display
Tions
Changing Mark Size
Small
Erasing Marks
Displaying Track and Mark Points
Erasing individual marks/lines
Erasing whole marks/lines
Waypoints
Entering Waypoints
Entering waypoints at own ship’s position
Entering waypoints at MOB position
Waypoint menu
Changing the shape and color of waypoint mark
Changing waypoint name, comment, proximity alarm radius
Entering waypoints by range and bearing
Entering waypoints by latitude and longitude position
Changing waypoint position
Erasing Individual Waypoints
Changing Waypoint Data
Erasing waypoints through the waypoint list
Erasing waypoints by the cursor
Changing Waypoint Position on the Plotter Display
Waypoint Mark Size
Searching Waypoints
This page is intentionally left blank
Routes
Entering Routes
Entering routes through the route list
Abcdef
Connecting Routes
Inserting, Removing Waypoints
Entering routes by the cursor
Inserting waypoints through the route list
Inserting waypoints on the plotter display
Removing waypoints from routes
Alph List
WPT
Creating Track-based Routes
Removing route waypoints from the plotter display
Erasing Routes
Save icon appearance On the plotter display
This page is intentionally left blank
Navigation
Navigating to Quick Points
Selecting quick point entry method
Navigating to a single quick point
Navigating to Ports, Port Services
Navigating to Waypoints waypoint list
Following a Route
Navigate route waypoints in reverse order
Navigate directly to a route waypoint
Navigate along specific leg of route
Switching waypoints
Setting speed for ETA calculation
Restarting navigation
Cancelling Navigation
This page is intentionally left blank
Plotter Alarms
Audio Alarm On/Off
Arrival Alarm
Introduction
Anchor Watch Alarm
XTE Cross Track Error Alarm
Speed Alarm
Proximity Alarm
Alarm messages
Alarm Information
Alarm messages and their meanings
Saving Data to Memory Card
Formatting Memory Cards
10-1
Saving data
Error message
Loading Data from Memory Card
10-2
Data overwrite
Configuration
10-3
Track
Waypoint/route
This page is intentionally left blank
Chart Setup Options menu
Chart Offset menu
Customizing Your Unit
11-1
Chart Details menu
Chart details menu description
Display Options menu
11-2
Display setup1 menu description
11-3
Display SETUP2 menu description
11-4
11.3 GPS/DGPS/TD Options menu
GPS Setup Options menu description
11-5
Dgps Setup Options
Dgps Setup Options menu
11-6
TD Setup menu
TD Setup
11-7
Displaying Loran C TDs
Sounder Setup Options menu
Sounder Setup Options menu description
Range Setup soft key
11-8
System Setup soft key
System Setup menu description
11-9
Echo Offset 200kHz, Echo Offset 50kHz
Configuration menu
Setup Nmea Port 1 menu description
Setup NMEA/DGPS Port 2 menu description
11-10
11-11
UPLOAD/DOWNLOAD Data menu
XON/XOFF
Download waypoint/route to PC
11-12
22 Connection of GP-1650DF/GP-1650F to PC
System menu
11-13
System Menu description
This page is intentionally left blank
Using C-MAP NT Model
12-2
Example of caution area window
12-3
Objects window
12-4
13 Plotter display
Setting Chart Setup Options
12-6
20 Depth Info display
12-7
21 Memory, I/O test results
This page is intentionally left blank
Maintenance & Troubleshooting
Maintenance
Recommended maintenance program
13-1
Replacement of Fuse, Battery
Simple Troubleshooting
Simple troubleshooting plotter
13-2
Error Messages
Simple troubleshooting sounder
Error messages
13-3
Diagnostic Tests
13-4
Memory, I/O port test
Test
Keyboard test
13-5
Display test
Clearing Memories
13-6
Furuno chart
Menu Tree
Sounder Setup Options
Audio Alarm ON, OFF
Loran C Chains
Decca Chains
World Time
Geodetic Chart List
General
GPS Receiver
Display Section
Plotter
Coating Color
Index
Index-1
Index-2
Index-3