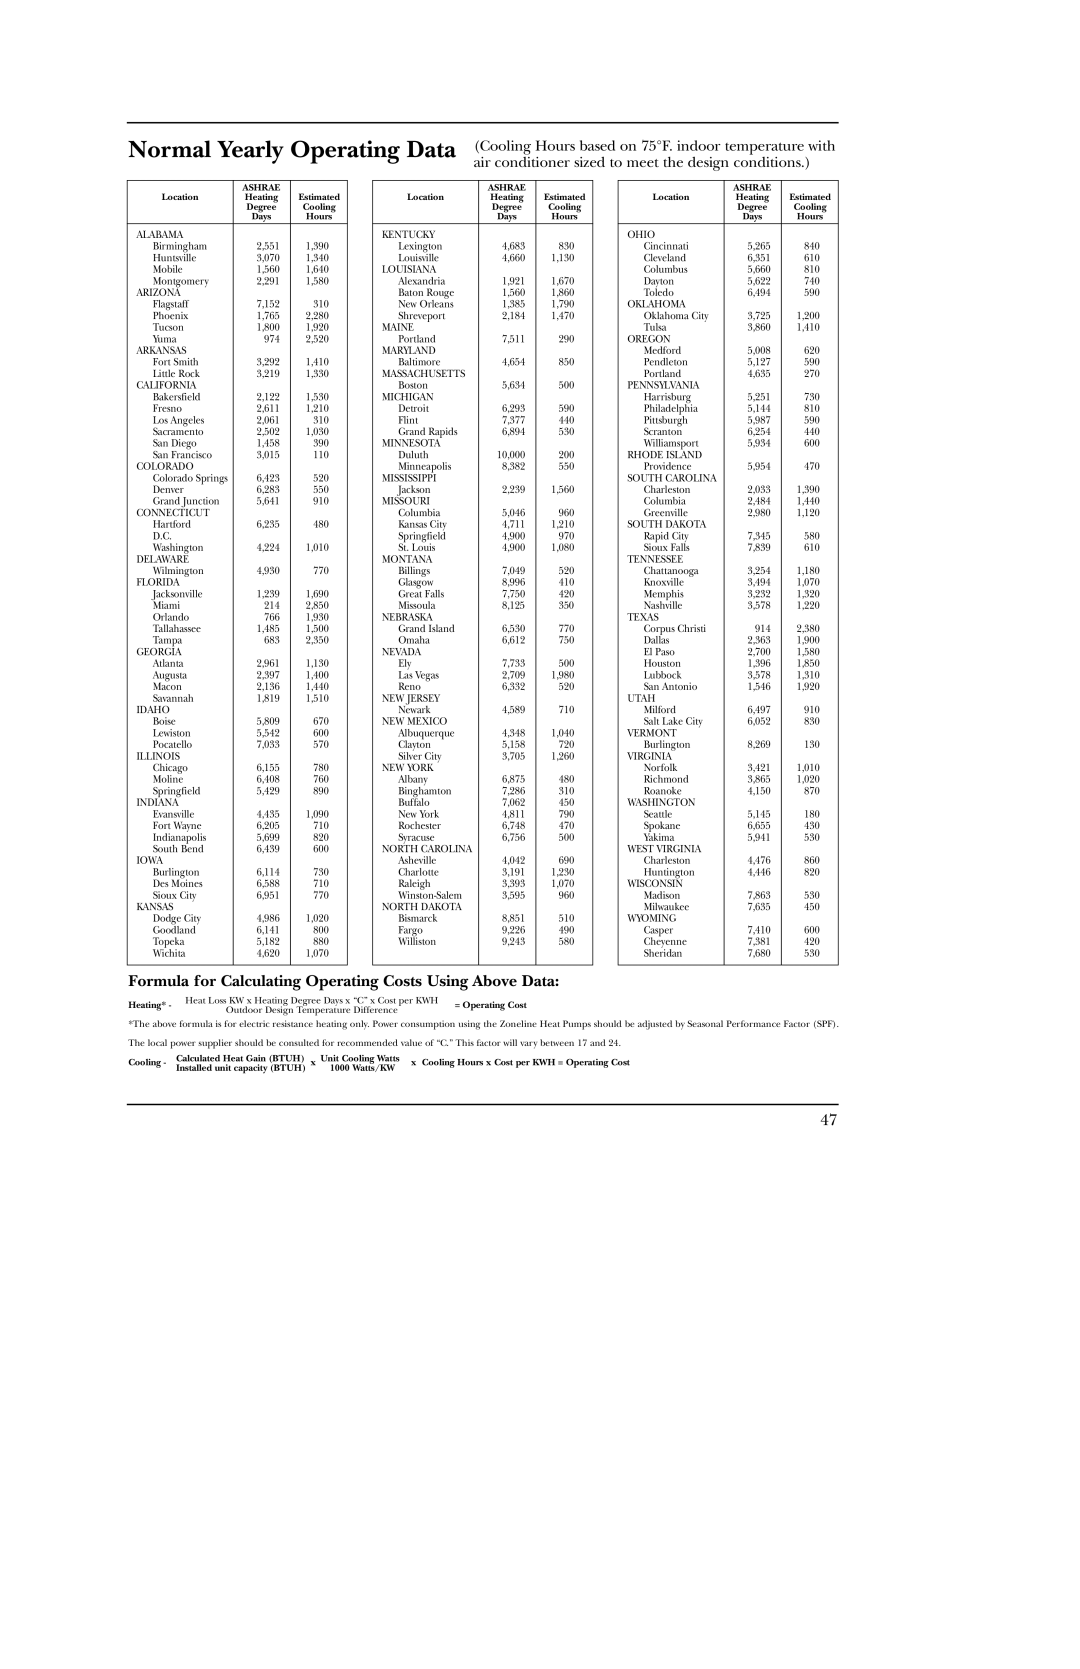
Normal Yearly Operating Data

(Cooling Hours based on 75°F. indoor temperature with


air conditioner sized to meet the design conditions.)


ASHRAE


Location

Heating

Estimated


Degree

Cooling


Days

Hours

ALABAMA


Birmingham

2,551

1,390

Huntsville

3,070

1,340

Mobile

1,560

1,640

Montgomery

2,291

1,580

ARIZONA


Flagstaff

7,152

310

Phoenix

1,765

2,280

Tucson

1,800

1,920

Yuma

974

2,520

ARKANSAS


Fort Smith

3,292

1,410

Little Rock

3,219

1,330

CALIFORNIA


Bakersfield

2,122

1,530

Fresno

2,611

1,210

Los Angeles

2,061

310

Sacramento

2,502

1,030

San Diego

1,458

390

San Francisco

3,015

110

COLORADO


Colorado Springs

6,423

520

Denver

6,283

550

Grand Junction

5,641

910

CONNECTICUT


Hartford

6,235

480

D.C.


Washington

4,224

1,010

DELAWARE


Wilmington

4,930

770

FLORIDA


Jacksonville

1,239

1,690

Miami

214

2,850

Orlando

766

1,930

Tallahassee

1,485

1,500

Tampa

683

2,350

GEORGIA


Atlanta

2,961

1,130

Augusta

2,397

1,400

Macon

2,136

1,440

Savannah

1,819

1,510

IDAHO


Boise

5,809

670

Lewiston

5,542

600

Pocatello

7,033

570

ILLINOIS


Chicago

6,155

780

Moline

6,408

760

Springfield

5,429

890

INDIANA


Evansville

4,435

1,090

Fort Wayne

6,205

710

Indianapolis

5,699

820

South Bend

6,439

600

IOWA


Burlington

6,114

730

Des Moines

6,588

710

Sioux City

6,951

770

KANSAS


Dodge City

4,986

1,020

Goodland

6,141

800

Topeka

5,182

880

Wichita

4,620

1,070


ASHRAE


Location

Heating

Estimated


Degree

Cooling


Days

Hours

KENTUCKY


Lexington

4,683

830

Louisville

4,660

1,130

LOUISIANA


Alexandria

1,921

1,670

Baton Rouge

1,560

1,860

New Orleans

1,385

1,790

Shreveport

2,184

1,470

MAINE


Portland

7,511

290

MARYLAND


Baltimore

4,654

850

MASSACHUSETTS


Boston

5,634

500

MICHIGAN


Detroit

6,293

590

Flint

7,377

440

Grand Rapids

6,894

530

MINNESOTA


Duluth

10,000

200

Minneapolis

8,382

550

MISSISSIPPI


Jackson

2,239

1,560

MISSOURI


Columbia

5,046

960

Kansas City

4,711

1,210

Springfield

4,900

970

St. Louis

4,900

1,080

MONTANA


Billings

7,049

520

Glasgow

8,996

410

Great Falls

7,750

420

Missoula

8,125

350

NEBRASKA


Grand Island

6,530

770

Omaha

6,612

750

NEVADA


Ely

7,733

500

Las Vegas

2,709

1,980

Reno

6,332

520

NEW JERSEY


Newark

4,589

710

NEW MEXICO


Albuquerque

4,348

1,040

Clayton

5,158

720

Silver City

3,705

1,260

NEW YORK


Albany

6,875

480

Binghamton

7,286

310

Buffalo

7,062

450

New York

4,811

790

Rochester

6,748

470

Syracuse

6,756

500

NORTH CAROLINA


Asheville

4,042

690

Charlotte

3,191

1,230

Raleigh

3,393

1,070

Winston-Salem

3,595

960

NORTH DAKOTA


Bismarck

8,851

510

Fargo

9,226

490

Williston

9,243

580


ASHRAE


Location

Heating

Estimated


Degree

Cooling


Days

Hours

OHIO


Cincinnati

5,265

840

Cleveland

6,351

610

Columbus

5,660

810

Dayton

5,622

740

Toledo

6,494

590

OKLAHOMA


Oklahoma City

3,725

1,200

Tulsa

3,860

1,410

OREGON


Medford

5,008

620

Pendleton

5,127

590

Portland

4,635

270

PENNSYLVANIA


Harrisburg

5,251

730

Philadelphia

5,144

810

Pittsburgh

5,987

590

Scranton

6,254

440

Williamsport

5,934

600

RHODE ISLAND


Providence

5,954

470

SOUTH CAROLINA


Charleston

2,033

1,390

Columbia

2,484

1,440

Greenville

2,980

1,120

SOUTH DAKOTA


Rapid City

7,345

580

Sioux Falls

7,839

610

TENNESSEE


Chattanooga

3,254

1,180

Knoxville

3,494

1,070

Memphis

3,232

1,320

Nashville

3,578

1,220

TEXAS


Corpus Christi

914

2,380

Dallas

2,363

1,900

El Paso

2,700

1,580

Houston

1,396

1,850

Lubbock

3,578

1,310

San Antonio

1,546

1,920

UTAH


Milford

6,497

910

Salt Lake City

6,052

830

VERMONT


Burlington

8,269

130

VIRGINIA


Norfolk

3,421

1,010

Richmond

3,865

1,020

Roanoke

4,150

870

WASHINGTON


Seattle

5,145

180

Spokane

6,655

430

Yakima

5,941

530

WEST VIRGINIA


Charleston

4,476

860

Huntington

4,446

820

WISCONSIN


Madison

7,863

530

Milwaukee

7,635

450

WYOMING


Casper

7,410

600

Cheyenne

7,381

420

Sheridan

7,680

530


Formula for Calculating Operating Costs Using Above Data:

Heating* -

Heat Loss KW x Heating Degree Days x “C” x Cost per KWH

= Operating Cost

Outdoor Design Temperature Difference


*The above formula is for electric resistance heating only. Power consumption using the Zoneline Heat Pumps should be adjusted by Seasonal Performance Factor (SPF).

The local power supplier should be consulted for recommended value of “C.” This factor will vary between 17 and 24.

Cooling -

Calculated Heat Gain (BTUH)

x

Unit Cooling Watts

x Cooling Hours x Cost per KWH = Operating Cost


Installed unit capacity (BTUH)


1000 Watts/KW


47

Page 47
Image 47
GE 5500 manual Normal Yearly Operating Data, Formula for Calculating Operating Costs Using Above Data

5500 specifications

The GE 5500 is a sophisticated gas turbine that represents a benchmark in the realm of power generation technology. Known for its impressive performance and efficiency, the GE 5500 has garnered attention in various industries, particularly in energy production. Designed for combined-cycle applications, this turbine effectively leverages both gas and steam cycles to optimize electricity generation.

One of the standout features of the GE 5500 is its advanced aerodynamics, which enhance the efficiency of the combustion process. The turbine employs state-of-the-art combustion technology that allows for high operational flexibility and minimizes emissions, meeting stringent environmental standards. This is particularly important in today’s energy landscape, where sustainability is a crucial focus.

The GE 5500 is equipped with a robust control system that utilizes digital twin technology. This innovative approach allows operators to simulate and analyze the performance of the turbine virtually, leading to improved operational efficiency and reduced downtime. Additionally, this turbine features an integrated health monitoring system that provides real-time data on performance metrics, allowing for predictive maintenance and enhancing overall reliability.

The materials used in the construction of the GE 5500 are engineered to withstand high temperatures and stress levels, ensuring longevity and durability. This includes high-performance alloys that maintain structural integrity even under extreme operating conditions.

Installation and maintenance of the GE 5500 are streamlined through its modular design, which simplifies access to components and reduces service time. This efficiency translates into lower operational costs, making the GE 5500 an economically favorable choice for utilities and independent power producers.

Furthermore, the GE 5500 can be integrated into a variety of power plant configurations, whether for peaking power or baseload operations, which adds to its versatility. Its ability to quickly ramp up production makes it particularly valuable in an energy market characterized by fluctuating demand.

Overall, the GE 5500 gas turbine is a remarkable engineering feat that combines cutting-edge technology with practical design. Its efficiency, reliability, and adaptability position it as a leading choice for power generation needs, meeting the requirements of modern energy systems while contributing to a more sustainable future.