Data Center EnvIronmental Edge specifications
HP Data Center Environmental Edge is a cutting-edge solution designed to optimize the efficiency and sustainability of data center operations. In an era where data centers consume enormous power and generate significant carbon footprints, HP's Environmental Edge provides an innovative approach to managing these challenges.One of the main features of the Environmental Edge is its advanced cooling solutions. Traditional cooling systems often operate inefficiently, leading to wasted energy and excessive costs. HP's system incorporates smart cooling technologies that adapt to the specific thermal demands of each data center room. By utilizing a combination of hot aisle/cold aisle containment and dynamic airflow management, the Environmental Edge ensures that cold air is effectively directed where it’s needed most, significantly reducing the amount of energy required to maintain optimal temperatures.
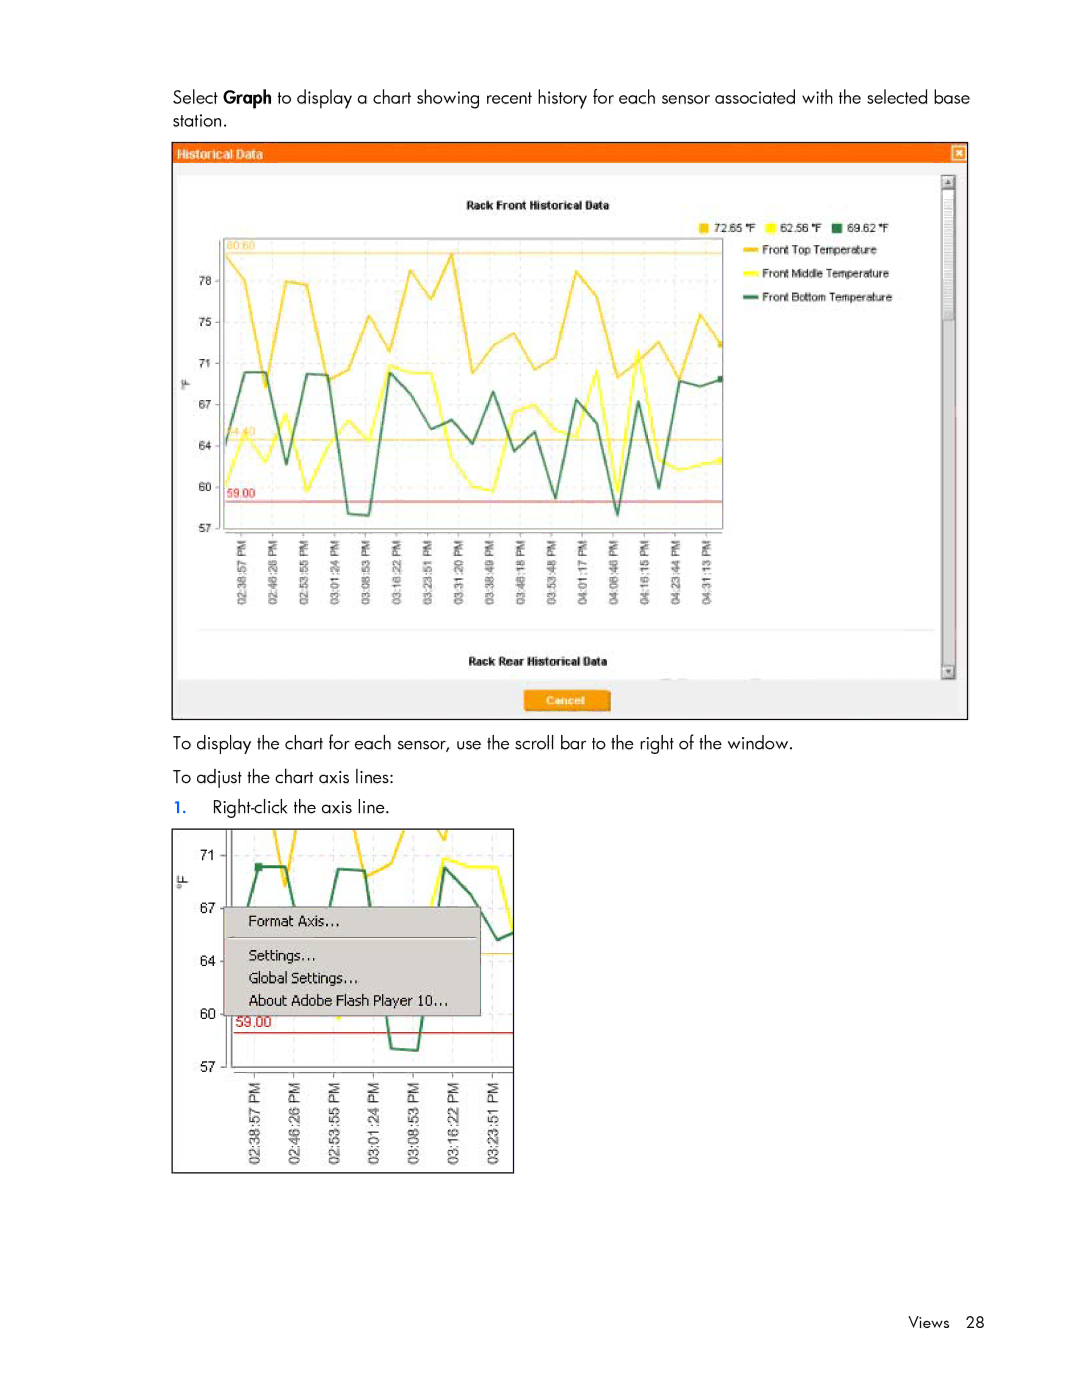
Another key characteristic of the HP Data Center Environmental Edge is its integration with IoT (Internet of Things) technologies. The solution employs a network of sensors that continuously monitor environmental conditions, including temperature, humidity, and air quality. This data is processed in real-time to provide actionable insights, allowing data center operators to make informed decisions regarding energy use and equipment deployment.
HP’s Environmental Edge also emphasizes modularity and scalability. As business needs evolve, data centers require flexible solutions that can grow with them. HP's approach incorporates modular components that can be easily integrated or upgraded, allowing businesses to expand their infrastructure without significant overhauls. This adaptability not only lowers upfront costs but also reduces waste, making it a more sustainable choice for organizations committed to environmental responsibility.
Sustainability is further enhanced through HP’s commitment to energy efficiency. The Environmental Edge utilizes advanced energy management software that calculates power consumption in real-time. This ensures that resources are used efficiently and helps organizations meet their green energy targets. Additionally, the system promotes the use of renewable energy sources, allowing data centers to minimize their reliance on fossil fuels.
In summary, the HP Data Center Environmental Edge stands out with its innovative cooling solutions, integration of IoT technologies, modular design, and energy efficiency initiatives. These features work together to create an intelligent, adaptive, and sustainable environment for data centers, addressing the pressing need for eco-friendly practices in the tech industry. As organizations navigate the complexities of modern data management, HP's Environmental Edge provides the tools needed to thrive in both performance and sustainability.

