Debugging with GDB Manual
Page
Table of Contents
Print settings Value history
Continuing and stepping Signals
Breakpoints
Stack frames
Examining the Symbol Table
Specifying a Debugging Target
Scramble previous memory contents at malloc/free calls
Stop when freeing unallocated or deallocated blocks
Batch Mode
Commands for heap profiling
Support for the dumpcore command
Support for the info target Command
Enhancements to the dumpcore command
Example Illustrating Execution Path Recovery
Support for steplast command for C and C++
Command for evaluating the address of an expression
Debugging the application using GDB under Aries
Detecting memory leaks using GDB under Aries
HP-UX Terminal User Interface
Setting Command History Feature in GDB 281 17.4
Miscellaneous commands 265 16.3
User-defined commands 287 18.2
Command files 289 Commands for controlled output 290
22.2 How to report bugs 361
20.7 Errors 302 20.8
20.9 Invalidation notices 303
304
List of Tables
List of Examples
Free Software
Summary of GDB
Contributors to GDB
Page
Contributors to GDB
Page
Sample GDB Session
Let us use GDB to try to see what is going on
Loading the Executable
Setting Breakpoints
Setting Display width
Here we describe how to set a breakpoint
Running the executable under GDB
Examining the Stack
Stepping into a subroutine
Printing Variable Values
Listing Source Code
Setting Variable Values During a Session
Gdb c Continuing Definebaz,defnQUOTEfooUNQUOTE Baz
Page
Invoking GDB
Getting In and Out of GDB
Files
Choosing files
Choosing modes
Processed. See Command files
Line number in a standard, recognizable fashion each
GNU Emacs sets this option when it runs GDB as a
Time a stack frame is displayed which includes each
Like two `\032 characters, followed by the file name
Emacs
Redirecting WDB input and output to a file
Quitting GDB
Interface
Shell commands
Page
Command syntax
GDB Commands
Command completion
GDB sounds bell press TAB again, to see
Getting help
Short list of named classes of commands
Help , h
Results
Apropos reload
Complete
This is intended for use by GNU Emacs
Getting help
Page
Compiling for debugging
Running Programs Under GDB
Starting your program
Arguments, so that you may use normal
Your program. SeeProgram Environment
See Arguments To Your Program
Directory
Program Environment
Arguments To Your Program
Program. See Program Input and Output
Display the list of search paths for executables
For example, this command
Path environment variable
Do not supply varname, print the names
Program Input and Output
Working directory
Debugging a Running Process
Killing the child process
Debugging programs with multiple threads
New process 35 thread
Thread apply command allows you to
Here are commands to get more information about threads
With the command argument threadno
Display a summary of all threads currently
Debugging programs with multiple processes
Unimpeded. This is the default
New process. The mode can be
Set the debugger response to a program call
Fork. The child process runs
Breakpoints
Stopping and Continuing
Setting breakpoints
Breakpoints
See Break conditions page 59, for more
Catchpoint
Breakpoint
Whether
Breakpoint is
Enabled
When hit
Marked to be
Breakpoints are
Setting catchpoints
Is currently only available for HP-UX
Call to vfork. This is currently only
Unloading of any dynamically loaded
Shared library, or the unloading
Disabling breakpoints
Deleting breakpoints
Selecting a frame page 73 . When
Break conditions
No symbol foo in current context
Breakpoint, GDB prints an error message
Stops your program only if the value
Use condition, GDB checks expression
Breakpoint command lists
Breakpoint menus
Cannot insert breakpoints
Conditions
Continuing and stepping
Function
Setting breakpoints page 52. This form of the command
Stops. See Automatic display
Signals
Info handle is an alias for info signals
Stopping and starting multi-thread programs
Stopping and Continuing
Stack frames
Examining the Stack
Stacks Without frames
Commands for Examining the Stack
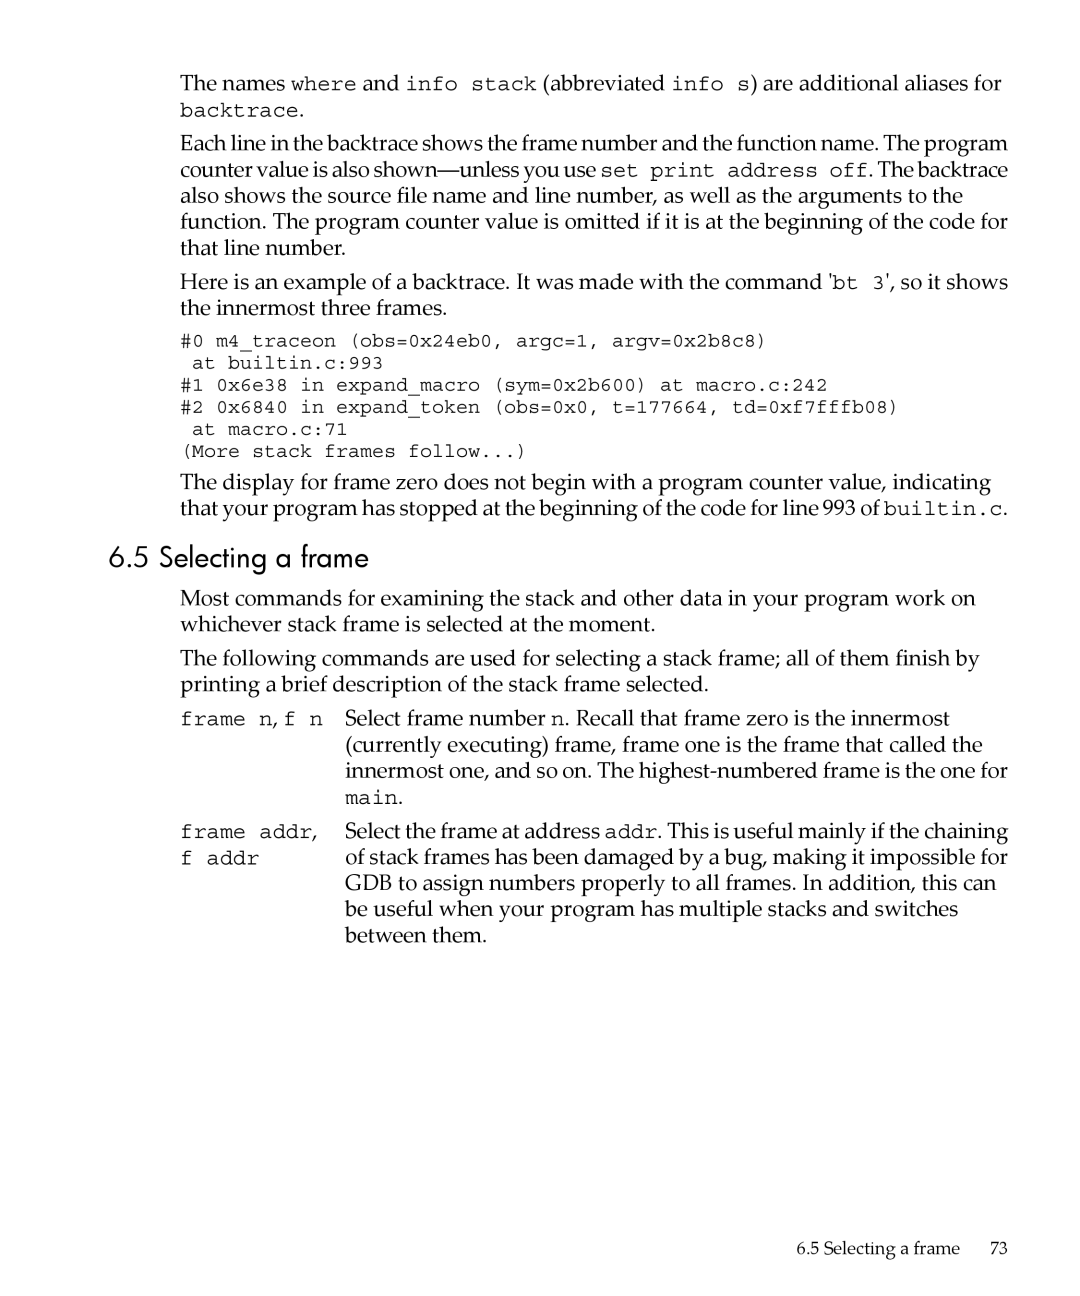
Backtraces
Selecting a frame
When used without any argument, this command does not
Have existed longer. n defaults to one
With an argument, this command is used to select a stack
Information about a frame
Setting catchpoints
Page
Printing source lines
Examining Source Files
List
Show listsize
Searching source files
Specifying source directories
Show directories
Source and machine code
Contains
Disassemble or x/i commands
Set disassembly-flavor
Select the instruction set to use when
Disassembling the program via
Page
Examining Data
Following forms of print command are supported
Expressions
To See Artificial arrays page 85, for more information
Program variables
Where it is defined. See Program variables
Type addr
Normally supposed to reside at addr
Artificial arrays
You can print the contents of array with
Output formats
Examining memory
Machine instruction. The default is
Print, s null-terminated string, or
Time you use either x or print
However, the count n must come first wx4 does not work
For fmt specifying only a display format and not a size or
Automatic display
See Output formats
For fmt i or s, or including a unit-size or a number
Print settings
File name and line number of a symbol
A symbol. This is the default
Symbolic form of an address
Address
Strings. When GDB starts, this limit is set to
Default is off
Setting number-of-elementsto zero
Short strings. The default is off
Show which format GDB is using to print
This is the default format
Print using only seven-bit characters if this
Default
Default is on
These settings are of interest when debugging C++ programs
Show whether C++ names in assembly listings
Would print
Value history
Convenience variables
Format in which the data was printed
Command, in which case it is a pointer to the type of $
$exitcode
Program being debugged terminates
Info registers Info all-registers Info registers regname
Registers
Or print the instruction to be executed next with
Or add four to the stack pointer3 with3with
Floating point hardware
Printing Floating Point Values
To get the bit pattern, try the following macro
This is what the macro produces
100
Switching between source languages
Using GDB with Different Languages
List of filename extensions and languages
Cpp
Not skip over function prologues when stepping
Setting the working language
Having GDB infer the source language
Files
Type and range checking
Displaying the language
An overview of type checking
An overview of range checking
Supported languages
C++
Non-zero for true
Expressions is 0 for false and non-zero for true
Left shift, and right shift. Defined on integral types
Types and pointer types
Double colons also represent the GDB scope operator see
Class types
Expressions page 83. Same precedence as , above
C++ constants
GDB expression handling can interpret most C++ expressions
1.3 C++ expressions
Printing the variable or class returns
C++ defaults
C++ type and range checks
GDB and C
GDB features for C++
Breakpoint menus
See Breakpoint menus
Fortran types
Fortran
Fortran types supported
Less than or equal to
Less than
Greater than
Greater than or equal to
Commonblockname
Fortran special issues
Block
Examining the Symbol Table
As with whatis, using ptype without an
Two commands give this output
Symbols will be read when needed
For example, for this variable declaration
Replace symbol definitions
Allow GDB to reload the symbols for
Do not replace symbol
Once. This is the default
Is in another source file. The default is on
Setting
Tell GDB to resolve opaque types. An opaque
Class, or union―for example, struct
Assignment to variables
Altering Execution
Stores the value 4 into that memory location
Continuing at a different address
You can use the following command to return from a function
Giving your program a signal
Returning from a function
Patching programs
Calling program functions
Return , return
Is used as the return value from the function value
Patching programs
124
GDB Files
Commands to specify files
See Optional warnings and messages
GDB has the entire symbol table available
Option with any of the commands that load
Write the symbols for your program into a
Map in symbol information from this auxiliary
Section
To display or set the threshold, use the commands
Symbols were loaded. Both the commands list
If threshold is nonzero, symbols from all
New library has been loaded, until the symbol
Searching the default system directories
Names where the desired shared libraries reside. GDB
Specifying shared library locations
Megabytes
Verbose on. See Optional warnings
Errors reading symbol files
Messages
Is the symbol type of the uncomprehended
Symbol scope block as starting on the previous
GDB circumvents the error by ignoring this
Debug your program, though certain symbols
Specifying a Debugging Target
Commands for managing targets
Active targets
See Commands to specify files
Choosing target byte order
Instruct GDB to assume the target is little-endian
Instruct GDB to assume the target is big-endian
Executable
Display GDBs current idea of the target byte order
Summary of HP Enhancements to GDB
HP-UX Configuration-Specific Information
Support for setting breakpoints using shared library name
Implementation of ask mode for set follow-fork-mode
Command watchtarget
Linker Dependencies
HP-UX dependencies
Dependent Standard Library Routines for Run Time Checking
Getpid Close Srand Strchr
Abort Unlink Atoi
Supported Platforms and Modes
Support for Alternate root
HP-UX targets
WDB Location
GDB location
Librtc.sl location $WDBROOT/bin Opt/langtools/ n/a
Specifying object file directories
None
Bin $WDBROOT/bin
Fix and continue debugging
Fix and Continue restrictions
Fix and Continue compiler dependencies
Using Fix and Continue
Compile the program
Example Fix and Continue session
Run the program
Gdb run
Gdb b main
Gdb edit
Make the necessary changes. In this case, add return total
Inline Debugging in HP 9000 Systems
Inline Support
Gdb q
Following options available for the set inline-debugcommand
Breakpoint info frame disassembly
Inline Debugging in Integrity Systems
Step next list backtrace frame n info locals info args
Debugging Inline Functions in Integrity Systems
Limitations
Debugging Macros
Info frame disassembly
Viewing and Evaluating Macro Definitions
Evaluating Macros
Compiler Options to Enable Macro Debugging
Debug=none
Examples for Macro Debugging
HP-UX Configuration-Specific Information
Debugging Memory Problems
Memory debugging restrictions
When to suspect a memory leak
Memory Debugging Methodologies
Debugging Memory in Interactive Mode
This command are ignored from report. If
Displays all current settings for memory
Heap growth. The default value is 100. Every
Command discards the data existing in the file
Debugging Memory Problems
Have occurred and WDB reports the problem
Debugging when the string option is set for
Specific pattern when it is allocated or
Such as attempting to access space that is freed
If the user specifies a value less than 16 for
Use the info command to show list of memory leaks
Number of bytes, the debugger ignores it
User-specified value
Setting Configuration Options for Batch Mode
Debugging Memory in Batch Mode
Gdb info leak
Sets the number of frames to be printed for leak context
Framecount=noframes or set heap-check frame-count noframes
For 64 bit IPF applications
For 32 bit IPF applications
For 64 bit PA applications
For 64-bit IPF applications
Ldpreload
Environment variable setting for Batch mode debugging
Aborts execution when out of memory
Aborts execution when heap objects
Log file for batch mode must be
Stderr error message goes to stderr
Example for Batch Mode RTC
Complete one of the following steps
Preload the librtc library as follows
Rtcconfig file should contain entries such as the following
Run the program as follows
For 32 bit PA applications
Run the program Start a debugging session as follows
Configuring memory debugging settings
Specifying the stack depth
Specifying minimum leak size
Scenarios in memory debugging
Stop when freeing unallocated or deallocated blocks
For example, if you use
Specifying minimum block size
Interactive debugging mode set heap-check scramble on off
Scramble previous memory contents at malloc/free calls
Syntax
Detect dangling pointers and dangling blocks
Detect in-block corruption of freed blocks
Off
Memory Debugging Commands in Interactive and Batch Mode
Point you use the info heap command
Commands for heap profiling
Heap Profiling
As the start of the heap, end of the heap, heap
Set a breakpoint
This example shows how to use this feature on HP-UX
Changes for a given run
Commands to track the change in data segment value
Support for Enabling and Disabling Specific Threads
Thread Debugging Support
Advanced Thread Debugging Support
Backtrace Support for Thread Debugging
Pre-requisites for Advanced Thread Debugging
Enabling and Disabling Advanced Thread Debugging Features
Unlock-not-own onoff The set thread-check unlock-not-own
Onoff command checks if an application
Mixed-sched-policy onoff The set thread-check
Cv-multiple-mxs onoff The set thread-check cv-multiple-mxs
User and prints a warning message when this
This returns an Einval error to
Command checks if any thread has terminated
Different mutexes. The debugger transfers
Command checks if a thread has terminated
When this condition is detected. This situation
Exception or a cancel without joining or
Created with the detach attribute. When an
Is provided, the command displays extended
Provided, the command displays extended
Condvar-id is provided, the command displays
Rwlock-id is provided, the command displays
For 64-bit PA applications
Thread Debugging in Batch Mode
For 64 bit IPF applications, set
Pre-requisites for Batch mode of Thread Debugging
For 64-bit PA applications, set
Set the environment variable Batchrtc to on as
And/Or
Opt/langtools/lib/hpux64/librtc.so
Where Pid is the process id
Thread Debugging in +check Mode
Limitations in Batch mode of thread debugging
Issue
Where pid is the process identifier
Debugging MPI Programs
Serial mode for set follow-fork-mode
Ask mode for set follow-fork-mode
Support for showing unwind info
Debugger response to a program call to fork or vfork is ask
Printing CFM and PFS registers
Command to Search for a Pattern in the Memory Address Space
Specifies the length of the memory address range. This
Parameter is mandatory when end-addressis not
String value. The character pattern must be enclosed
Within double quotes. This parameter is mandatory
Example 14-1 Sample Output for the find command
Using the /size-charparameter
Using the /max-countparameter
Str0 Specifies the starting address
Specifies the pattern expr1
Generating core files with packcore /unpackcore/getcore
Debugging Core Files
Support for the info target Command
When starting from the HP WDB command line
Support for the dumpcore command
When starting from the shell prompt
Enhancements to the dumpcore command
Support for display of run time type information
When starting from shell prompt
Info rtti address
Sample Output
Info global-exec-path summary
Info exec-path summary
Exec-path updownpathindex aliased to ep
Sample Program
Example Illustrating Execution Path Recovery
Sample Debugging Session
Command to Unwind Beyond 10000 Frames
Invoking GDB Before a Program Aborts
Aborting a Command Line Call
Enhanced support for watchpoints and breakpoints
Instruction Level Stepping
Deferred watchpoints
Hardware watchpoints
Support for template breakpoints
Support for procedural breakpoints
Rbp
Rdp
Debugging support for shared libraries
Using shared library as main program
Using catch load
Setting Deferred Breakpoints in Shared Library
Privately mapping shared libraries
Opt/langtools/bin/pxdb -s on executable-name
Selectively Mapping Shared Libraries As Private
Enhancement to the info shared Command
Setting breakpoints in shared library
Debugging support for Decimal Floating Point data type
Printing Decimal Floating point data types
Printing NaT Registers
Following are sample commands to print NaT registers
Handling Decimal Floating Point Data types
Evaluating Decimal Floating Point data types
Arithmetic Operations
Assignment of Decimal floating point value to variable
Comparison Operations
Printing type of Decimal Floating Point variable
Support for Binary Floating Point constants f, l
Additional Support for binary floating point data type
This prints the binary floating point value as oat
This prints the binary floating point value as double
Language support
Java Stack Unwind Features
Enhanced Java Debugging Support
Gdb help java
Gdb Subcommands for Java VM Debugging
Java and native stack frames
Frame command of GDB has been enhanced to interpret a Java
Info frame
Stack frame
Java corefile debugging support
Java attach mode debugging support
Syntax
Enhanced support for C++ templates
Support for Complex variables in HP C
Support for fpreg data type on IPF
Support for debugging namespaces
Viewing Wide Character Strings
Command for evaluating the address of an expression
This is equivalent to executing
Support for dumping array in an Ascii file
Support for output logging
Support for Fortran array slices
Support for steplast command for C and C++
Displaying enumerators
Support for debugging typedefs
Getting information from a non-debug executable
Break Call Clear Disassem List
Debugging optimized code
Break Call Cond Jump Return Print Set var Watch Whatis
HP-UX Configuration-Specific Information
14.29.1.1 +O0 and +O1
Debugging Optimized Code at Various Optimization Levels
14.29.1.2 +O2/+O3/+O4/-ipo
Debugging with Aries
Following limitations apply when debugging optimized code
+O2 or -O
Limitations of GDB Support under Aries
Debugging the application using GDB under Aries
Attaching GDB to an already running emulated process
Detecting memory leaks using GDB under Aries
Starting and stopping Visual Interface for WDB
Visual Interface for WDB
Visual Interface for WDB GUI display
Navigating the Visual Interface for WDB display
Specifying foreground and background colors
Using the X-window graphical interface
Changing the size of the source or debugger pane
Using the TUI mode
For dterm, use the following
Editing the command line and command-line history
Using commands to browse through source files
Saving the contents of a debugging session to a file
Loading source files
GNU GDB Logging Commands
Support for XDB commands
Support for command line calls in a stripped executable
Stop in/at dbx commands
For 32-bit applications
Execute the chatr -B immediate executable command
Support for debugging stripped binaries
Command line calls to non-stripped library
For 64-bit applications
Printing of locals and globals in a stripped module
Linux support
Displaying the current block scope information
Syntax
242
HP-UX Terminal User Interface
Invoke the debugger using a command like the following
Starting the TUI
Main
Screen Layouts
Automatically running a program at startup
Disassembly pane appears when you issue the command
Disassembly pane
Source pane
Pane looks like this
Disassembly/Register pane
Source/Disassembly pane
Source/Disassembly pane appears when you issue the command
Source/Register pane
Source/Register pane appears when you issue the command
Toggle split-screen mode
Use the commands
Cycling through the panes
Changing pane focus
Fs regs Foc next
Changing the register display
Scrolling panes
Changing the pane size
Refreshing and updating the window
XDB to WDB Transition Guide
By-function lists of XDB commands and HP WDB equivalents
Window mode commands
Invocation commands
Invocation commands
Window mode commands
File viewing commands
File viewing commands
Data Viewing and modification commands
Source directory mapping commands
Ll string Lm string
Data viewing and modification commands
Stack viewing commands
Stack viewing commands
Job control commands
Status-viewing command
Status viewing commands
Job control commands
Auxiliary breakpoint commands
Overall breakpoint commands
Overall breakpoint commands
Auxillary breakpoint commands
Breakpoint creation commands
10 Breakpoint creation commands
11 Overall breakpoint commands
Breakpoint status commands
Global breakpoint commands
All-procedures breakpoint commands
12 Global breakpoint commands
Bp bpt bpx dp Dpt Dpx
Record and playback commands
Assertion control commands
Macro facility commands
Miscellaneous commands
Signal control commands
13 Macro facility commands
14 Signal control commands
16 Data format commands
Format of the print command is different in XDB and GDB
XDB data formats and HP WDB equivalents
Decimal integer
XDB location syntax and HP WDB equivalents
17 Macro facility commands
XDB special language operators and HP WDB equivalents
18 Special language operators
XDB special variables and HP WDB equivalents
19 Special variables
XDB variable identifiers and HP WDB equivalents
Alphabetical lists of XDB commands and HP WDB equivalents
16.8.1 a
20 Variable Identifiers
22 B
16.8.2 B
23 C through D
Through D
16.8.5 L
Through K
24 F through K
25 L
26 M through P
Through P
16.8.8 T
Through S
27 Q through S
28 T
29 U through Z
Through Z
30 Symbols
Symbols
Any string
Control-C # text
280
Setting Command Editing Options in GDB
Setting the GDB Prompt
Setting Command History Feature in GDB
Controlling GDB
To fname. This is the file where GDB reads an
Control the settings
Exits. You can access this list through history
Expansion or through the history command
Supported Number Formats
Setting the GDB Screen Size
Optional warnings and messages
Set confirm on
Optional messages about internal happenings
Show confirm Displays state of confirmation requests
Object debugging info
Show debug varobj
User-defined commands
Canned Sequences of Commands
User-defined command hooks
To add source directories or
Command files
Commands for controlled output
Output formats
Expressions
292
Using GDB under gnu Emacs
Execute to next instruction, using the GDB nexti command
Calls, like the GDB next command. Then update the display
Update display window accordingly
GDB up command
295
296
GDB Annotations
What is an annotation?
Server prefix
Values
When printing a structure, GDB annotates it as follows
Frames
When printing an array, GDB annotates it as follows
Frame annotation begins with
Then comes
Annotation for GDB input
Displays
Information on breakpoints
Errors
Running the program
Invalidation notices
Displaying source
Target-invalid
Annotations We Might Want in the Future
306
GDB/MI Interface
21.1 GDB/MI Command Syntax
21.1.2 GDB/MI Output syntax
Done running connected error exit
Pragmatics
Value Const tuple list String Tuple →
21.2 GDB/MI compatibility with CLI
Here is what happens if you pass a bad command
Simple examples of GDB/MI interaction
Here is an example to evaluate an expression
21.3 GDB/MI output records
21.4 GDB/MI command description format
21.3.1 GDB/MI result records
21.3.2 GDB/MI stream records
-break-after Command
21.5 GDB/MI breakpoint table commands
Corresponding GDB command is condition
-break-condition command
-break-disable command
-break-delete command
Corresponding GDB command is delete
Corresponding GDB command is disable
-break-info Command
-break-enable command
Result
-break-insert command
-break-list command
Corresponding GDB commands are watch, awatch, and rwatch
-break-watch command
Setting a watchpoint on a variable in the main function
Exec-continue running gdb
21.6 GDB/MI Data manipulation
-data-disassemble command
Disassemble from the current value of $pc to $pc +
There is no direct mapping from this command to the CLI
Disassemble 3 instructions from the start of main
-data-evaluate-expression command
-data-list-register-names command
-data-list-changed-registers Command
Display a list of the registers that have changed
On a PPC MBX board
-data-list-register-values command
Space should be quoted using the C convention
-data-read-memory command
To be read. Complex expressions containing embedded white
Word-format Word-sizenr-rowsnr-cols aschar
-display-disable Command
-display-delete command
-display-insert Command
-display-enable command
-display-list command
-environment-cd command
-environment-path command
-environment-directory command
Corresponding GDB command is pwd
-environment-pwd command
21.7 GDB/MI program control
Show the current working directory
-exec-arguments command
-exec-abort command
-exec-continue command
-exec-interrupt command
-exec-finish command
Corresponding GDB command is finish
Corresponding GDB command is interrupt
-exec-next-instruction command
-exec-nextcommand Synopsis
Corresponding GDB command is next
Corresponding GDB command is nexti
-exec-runcommand Synopsis
-exec-return command
Corresponding GDB command is return
Corresponding GDB command is run
Example -exec-stepCommand Synopsis
-exec-show-arguments command
-exec-until command
-exec-step-instruction command
Corresponding GDB command is stepi
Regular stepping
-file-exec-file command
-file-exec-and-symbols command
Corresponding GDB command is until
Corresponding GDB command is file
-file-list-exec-source-files command
-file-list-exec-sections command
-file-list-shared-libraries command
-file-list-symbol-files command
Miscellaneous GDB commands in GDB/MI
-file-symbol-file command
-gdb-exitcommand Synopsis
-gdb-showcommand Synopsis
-gdb-setcommand Synopsis
-gdb-version command
-stack-info-frame command
21.9 GDB/MI Stack Manipulation Commands
-stack-info-depth command
For a stack with frame levels 0 through
-stack-list-arguments command Synopsis
-stack-list-frames command
Full stack backtrace
Corresponding GDB commands are backtrace and where
Show frames between lowframe and highframe
Show a single frame
-stack-select-frame command
-stack-list-locals command
Info locals in GDB, gdbgetlocals in gdbtk
-symbol-info-address command
21.10 GDB/MI Symbol query commands
-symbol-info-file command
-symbol-info-function command
-symbol-info-symbol command
-symbol-info-line command
-symbol-list-functions command
-symbol-list-types command
-symbol-locate command
-symbol-list-variables command
-symbol-type command
-target-attach command
21.11 GDB/MI Target Manipulation Commands
-target-compare-sections command
-target-detach command
Corresponding GDB command is load
-target-download command
Name of the section
At the end, a summary is printed
-target-exec-status command
-target-list-current-targets command
-target-list-available-targets command
-target-list-parameters command
-target-select command
21.12 GDB/MI thread commands
-thread-info command
-thread-list-all-threads command
-thread-select command
-thread-list-ids command
Tracepoint commands are not yet implemented
21.13 GDB/MI tracepoint commands
21.14 GDB/MI variable objects
GDB/MI Operations
-var-create command
Description and use of operations on variable objects
-var-set-format command
-var-delete command
-var-show-format command
-var-info-num-children command
-var-info-type command
-var-list-children command
-var-info-expression command
-var-show-attributes command
-var-update command
-var-assign command
360
Reporting Bugs in GDB
How to report bugs
Have you found a bug?
Reporting Bugs in GDB
How to report bugs
364
Installing GDB
Gdb-gdb-199991101/mmalloc
Compiling GDB in another directory
Package
Specifying names for hosts and targets
Separate directories. configure writes configuration
Configure options
To use the source in the directory dirname. configure
Srcdir= dirname
All available targets
Target=target