HPjmeter 4.2 Users Guide
Document Notice
Table of Contents
Monitoring Applications
Analyzing Garbage Collection Data
116
Unfinalized Objects
Live Objects Bytes
199
187
192
197
Additional HPjmeter Documents Related Information
About This Document
Intended Audience
Typographic Conventions
HP Encourages Your Comments
Publishing History
Introducing HPjmeter
Features
JVM Agent
Concepts
Node Agent
Console Requirements
Completing Installation of HPjmeter
Platform Support and System Requirements
Agent Requirements
Preparing to run Java
Completing the installation
File Locations
Attaching to the JVM Agent of a Running Application
On Java
Example Usage
Showing Version Information
JVM Agent Options
Selecting Other JVM Agent Options
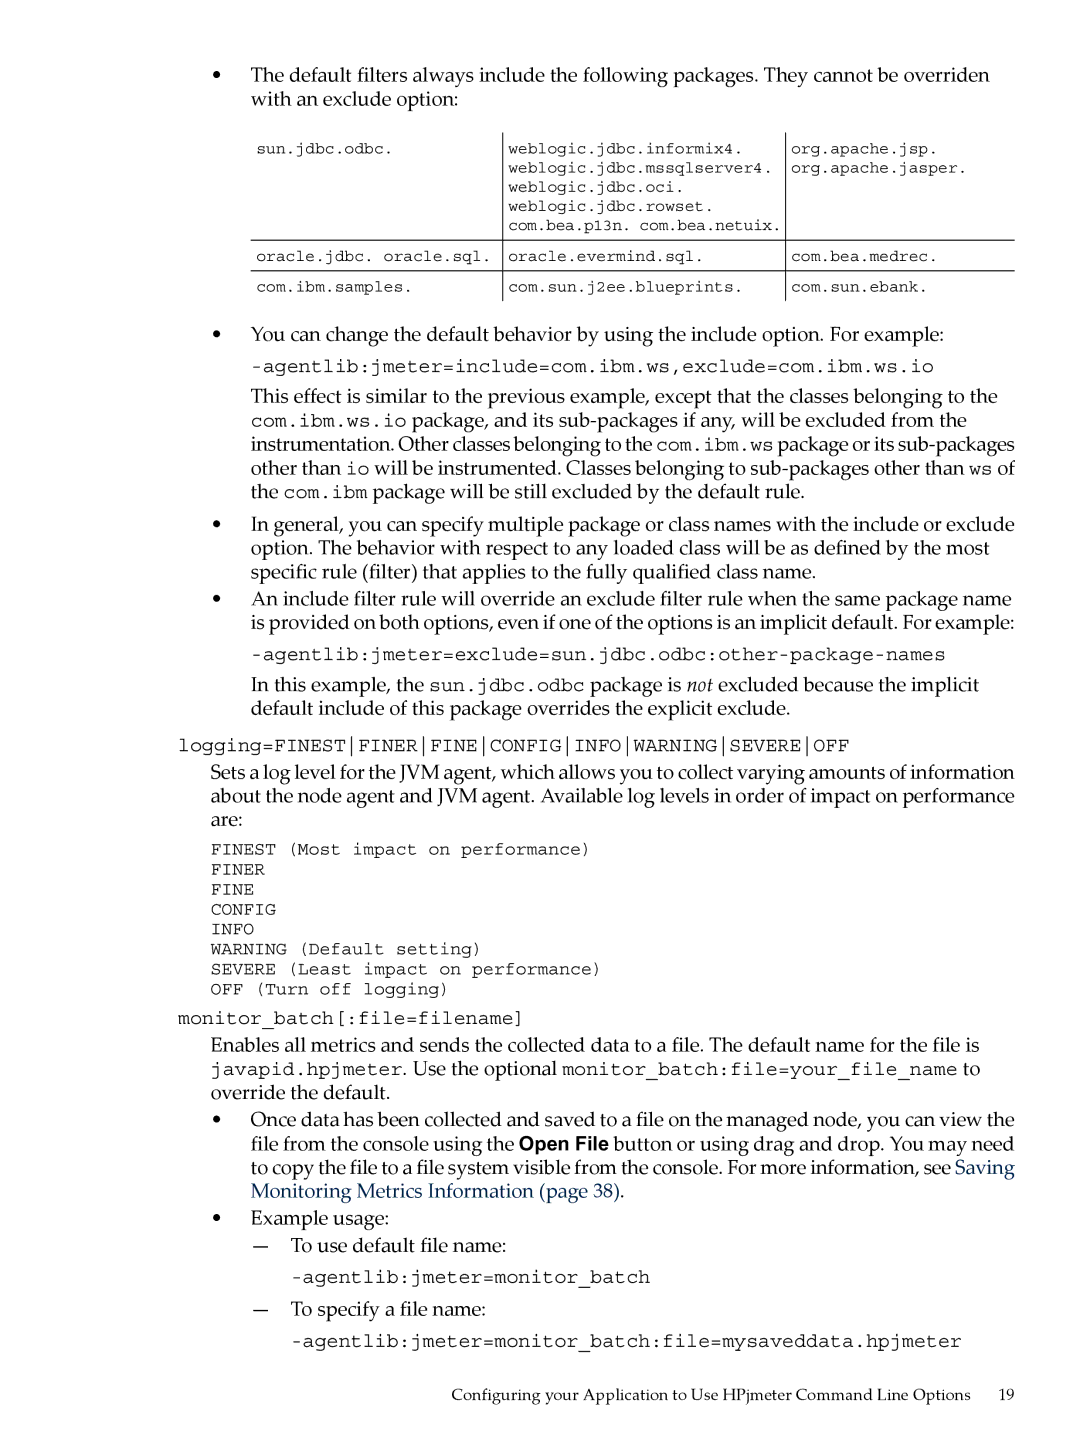
Include=filter1filter2..., exclude=filter1filter2
To specify a file name
Noalloc
JVM Options Usage Examples
Security Awareness
Working with Firewalls
Configuring User Access
Getting Started
Using HPjmeter to Monitor Applications
To connect to a node agent via a SecureShell SSH tunnel
Using HPjmeter to Monitor Applications
Set Session Preferences
When the Optional Port Box Is Not Used
Getting Started
Changing Session Preferences During a Session
Using HPjmeter to Analyze Profiling Data
View Monitoring Metrics During Your Open Session
Configure your application
Using HPjmeter to Analyze Garbage Collection Data
Monitoring Demonstration Instructions
Memory Leak Applications
See also Heap Usage Notification
Thread Deadlock Sample
Thread Deadlock Example Display
Monitoring Applications
Setting Data Collection Preferences
Controlling Data Collection and Display
Verifying HP-UX Daemon is Running
Managing Node Agents
Managing Node Agents On HP-UX
Running Node Agent as a Daemon
Stopping Node Agents
Node Agent Access Restrictions
Saving Monitoring Metrics Information
Running Multiple Node Agents
Identifying Unexpected CPU Usage by Method
Diagnosing Errors When Monitoring Running Applications
Naming Monitoring Data Files
Saving Data from the Console
Viewing the Application Load
Checking for Application Paging Problems
Checking for Long Garbage Collection Pauses
Reviewing the Percentage of Time Spent in Garbage Collection
Identifying Excessive Calls to System.gc
Monitoring Applications
Confirming Java Memory Leaks
Checking for Proper Heap Sizing
Determining the Severity of a Memory Leak
Identifying Multiple Short-lived Threads
Identifying Excessive Object Allocation
Identifying the Site of Excessive Object Allocation
Identifying Abnormal Thread Termination
Identifying Deadlocked Threads
Identifying Excessive Lock Contention
Identifying Excessive Thread Creation
Example Metric Method Compilation Count
Identifying Excessive Method Compilation
Identifying Too Many Classes Loaded
Using the JMX Viewer
JMX Summary Tab
Understanding the JMX Summary View
JMX Memory Tab
Appearance of the Summary JMX Viewer When First Opened
JMX Viewer with Summary Memory Tab Selected
JMX Viewer with Summary Threads Tab Open
JMX Threads Tab
JMX Runtime Tab
Changing Mbean Values and Monitoring the Result
JMX Notifications Tab
MBean Filter
Using the Functions in the JMX Server View
MBean Attribute Tab
10 MBean Operations Tab Open for Display
MBean Operations Tab
MBean Information Tab
MBean Notifications Tab
12 MBean Information Tab Open for Display
Profiling Overview
Profiling Applications
Tracing
Tuning Performance
Sampling
Preparing a Benchmark
Profiling with -Xeprof
Collecting Profile Data
Profiling with Zero Preparation
If timeon=sig... has not been specified, the default is
Following options are useful
Profiling with -agentlibhprof
Supported -agentlibhprofoptions
Generate more complete call graphs
Naming Profile Data Files
Inclusive Method CPU Times
Profiling with -Xeprof Profiling with -agentlibhprof
Looking at the Data from the Top Down
Approaches to Analyzing Performance Data
Considerations in Interpreting the Data
Looking at the Data from the Bottom Up
CPU Versus Clock Time
Locating Summary Information for Saved Data Sets
Inclusive Versus Exclusive Time
Time Units
Estimate menus
Adjusting Scope
Comparing Profiling Data Files
Scaling Comparison Data
Key to Thread States Reported by
Reading Profiling Histograms
Interpreting the Histogram Presentation
Interpreting Call Graph Data
Using Call Graph Trees
Example of Node Color Display
Auto-Expanding the Call Tree
Using Sub-Trees
Options for Manipulating the Call Tree Display
Tree Pruning
Searching the Trees
Using Heuristics to Locate Possible Hot Spots
Using Heuristics to Locate Possible Hot Spots
Obtaining Garbage Collection Data
Analyzing Garbage Collection Data
Data Collection with -Xverbosegc
Java ... -Xverbosegchelp
13, Old generation, in bytes. These spaces are reported
Collecting Glance Data for Viewing in HPjmeter
Collecting GC Data with Zero Preparation
Related Topics
Data Collection with -Xloggc
Naming GC Data Files
Using -XX+PrintGCDetails and -XX+PrintHeapAtGC Together
Comparing Garbage Collection Data Files
Key to Garbage Collection Types Recognized by HPjmeter
Basic Garbage Collection Concepts
Common Garbage Collection Types Recognized by HPjmeter
Understanding the Summary Presentation of GC Data
Summary Panel Showing Garbage Collection Statistics
Understanding the System Details Captured with GC Data
Basic Garbage Collection Concepts
Analyzing Garbage Collection Data
Using the Main Window Functions
Using the Console
Starting the Console
Main Console Window
Data Representation
Node Agent
Icons and Their Meaning
JVM Agent
Time Slice Entries
Open and Cached Sessions
Saving Data
Console Menu Choices
Console Tool Bar Buttons
Remember Main Window Location
Monitor Menu
Console Guide Location and First Screen
Console Guide
Status Bar
Setting Monitoring Session Preferences
Specifying Metrics to Collect for Monitoring
Enabling Monitoring Alerts
Editing Filters
Specifying Filters for Monitoring
Adding Filters
Viewing Monitoring Data in HPjmeter
Using Alerts
Specifying Filter Sets
Appearance of Alert Threshold in GC Duration Visualizer
Appearance of Alert Notices in the Main Console Pane
Using the Alert Controller
Alert Controller Window
Viewing a Log of the Alert History
Editing E-mail Notification Attributes
Abnormal Thread Termination Alert
Responding to Alerts
Identifying Abnormal Thread Termination Thread Histogram
Excessive Compilation Alert
Expected Out Of Memory Error Alert
GC Duration Notification
Java Collection Leak Locations Alert
Heap Usage Notification
13 Java Collection Leak Locations Visualizer
Array Leak Locations Alert
14 Array Leak Locations Visualizer
Process CPU Usage Alert
System CPU Usage Alert
Unfinalized Queue Growth
Thread Deadlock Alert
Profiling Data Viewer
Using Visualizer Functions
Locating Information About a JVM and its Environment
Using Monitoring Displays
Java Method HotSpots
Monitor Code and/or CPU Activity Menu
Details
Thrown Exceptions with Stack Traces
Thrown Exceptions
Monitoring Metric Thrown Exceptions with Stack Traces
Heap Monitor
Monitor Memory and/or Heap Activity Menu
Monitoring Metric Garbage Collections
Garbage Collections
GC Duration
Percentage of Time Spent in Garbage Collection
Unfinalized Objects
Allocated Object Statistics by Class
Allocating Method Statistics
Current Live Heap Objects
Name of class to which object belongs
Thread Histogram
Monitor Threads and/or Locks Menu
Already acquired by another thread
14 Monitoring Metric Lock Contention
Lock Contention
Method Compilation Count
Monitor JVM and/or System Activity Menu
Loaded Classes
Method Compilation Frequency
17 Monitoring Metric Loaded Classes Related Topics
Percent % CPU Utilization
Viewing Profiling or GC Data in HPjmeter
Using Profile Displays
Using Visualizer Functions
Inline Candidates Exceptions Thrown Memory Leaks
Profile Code and/or CPU Activity
Menu Choices
Method Call Count
Exclusive Method Clock Times
Exclusive Method Times CPU
Call Graph Tree with Call Count
Inclusive Method Clock Times
Call Graph Tree with CPU
Call Graph Tree with Clock Time
Inclusive Method CPU Times
Starvation by Method
Average Exclusive Method Clock Times
Average Inclusive Method CPU Times
Average Inclusive Method Clock Times
Exclusive Class CPU Times
Profile Memory and/or Heap Activity
Starvation Ratio
Methods with Loops
Live Objects Count
Objects Created by Method
Created Objects Count
Created Objects Bytes
Reference Sub-Trees by Size
Reference Graph Tree
Using Profile Displays
For string and char arrays, see String and char arrays
21 Long String Pop-up Box
23 Class Loaders Visualizer
Class Loaders
24 Class Types Pop-up Window Guidelines
Threads Histogram
Profile by Threads
Residual Objects Count
Residual Objects Bytes
Thread Groups Histogram
Profile by Locks
All Lock Claims by Method
Lock Delay Method Exclusive
Lock Delay Call Graph Tree
Contested Lock Claims by Method
Exclusive Method Lock Delay / Clock Time
Lock Delay Method Inclusive
Lock Contention Ratio by Method
Average Exclusive Method Lock Delay
Exceptions Thrown
Using Heuristic Metrics from the Estimate Menu
Exclusive Class Lock Delay
Inline Candidates
Heap Usage After GC
Using Specialized Garbage Collection Displays
27 GC Metric Heap Usage After GC Related Topics
Duration Stop the World
28 GC Metric Duration Related Topics
Cumulative Allocation
29 GC Metric Cumulative Allocation Related Topics
Creation Rate
30 GC Metric Creation Rate Related Topics
Allocation Site Statistics
31 GC Metric Combined Sets of Allocation Site Statistics
32 GC Metric Separated Sets of Allocation Site Statistics
Using Visualizer Functions
Filter Field Descriptions
Using Visualizer Functions
User-Defined X-Y Axes
37 User-Defined Comparisons of GC Metrics Related Topics
Multiple User-Defined
38 Multiple User-Defined Metrics
Glance Data
40 GC Metric Glance Data
41 Glance Data Metric Configuration Box
Run Queue Average
Are private
Glance System Call Data
42 GC Metric Glance System Call Data
Common Tool Bar Buttons
Using Visualizer Tool Bars
Tool Bar Buttons for Manipulating Graphical Data
Tool Bar Buttons for Manipulating Tabular Data
Tool Bar Buttons for Manipulating Garbage Collection Data
Mark an Item for Search
Special Button or Other Gadget Functions
Find a Search Pattern
44 Locating an Item
Changing Time Interval in GC Data Visualizers
Pause or Resume Graphical Time-based Scrolling
46 The View Menu Selections in the GC Viewer
Using Visualizer Tool Bars
Changing Time Interval in Monitoring Visualizers
50 Time Interval Use in a Monitoring Visualizer
Change Color Selection for Histogram Display
Thread Histogram Profile by Threads
Performance Overhead on Running Applications
Understanding How HPjmeter Works
Data Sampling Considerations
Using Confidence Interval to Indicate Sample Validity
Console Overhead
How Memory Leak Detection Works
Related Topics
Page
Identifying Version Numbers
Troubleshooting
Installation
Documentation and Support
See also To Take Advantage of Dynamic Attach
Console
JVM agent
If you see this JVM agent error on startup
Zero Preparation Profiling
Node agent
Unexpected Behavior in Visualizers
Quick References
Connecting to the HPjmeter Node Agent
Start and stop verbose GC data 0.14 0.02
Glossary
Active mode
Jvmpi
SSL
Index
Symbols
Alert Notification Editor, 107 alerts
Restore Roots
Alert Notification Editor, 108 count
Collecting with zero preparation, 83 GC event
Glance system call data, 174 graphical scrolling
JVM
Duration Stop the World, 158 enable, 99
User-Defined X-Y Axes for GC analysis, 167 viewing, 29
Program termination, 47 overhead
Scale Special, 72 scaling data
Xeprofoptions
Xbootclasspath