Table
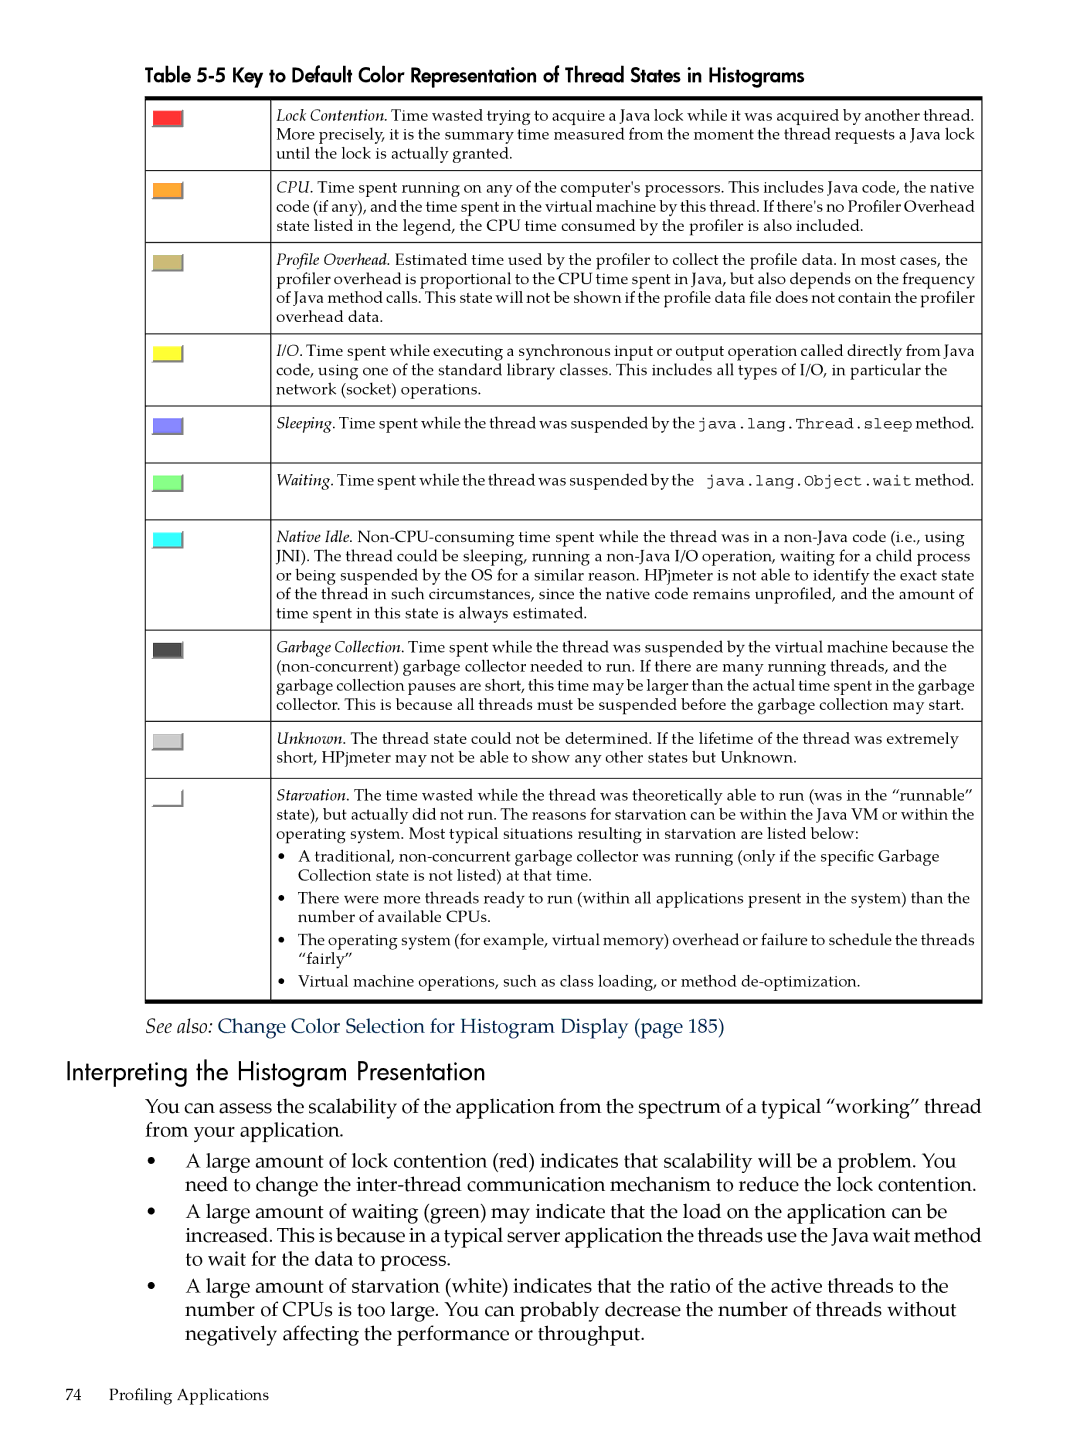
Lock Contention. Time wasted trying to acquire a Java lock while it was acquired by another thread. More precisely, it is the summary time measured from the moment the thread requests a Java lock until the lock is actually granted.
CPU. Time spent running on any of the computer's processors. This includes Java code, the native code (if any), and the time spent in the virtual machine by this thread. If there's no Profiler Overhead state listed in the legend, the CPU time consumed by the profiler is also included.
Profile Overhead. Estimated time used by the profiler to collect the profile data. In most cases, the profiler overhead is proportional to the CPU time spent in Java, but also depends on the frequency of Java method calls. This state will not be shown if the profile data file does not contain the profiler overhead data.
I/O. Time spent while executing a synchronous input or output operation called directly from Java code, using one of the standard library classes. This includes all types of I/O, in particular the network (socket) operations.
Sleeping. Time spent while the thread was suspended by the java.lang.Thread.sleep method.
Waiting. Time spent while the thread was suspended by the java.lang.Object.wait method.
Native Idle.
Garbage Collection. Time spent while the thread was suspended by the virtual machine because the
Unknown. The thread state could not be determined. If the lifetime of the thread was extremely short, HPjmeter may not be able to show any other states but Unknown.
Starvation. The time wasted while the thread was theoretically able to run (was in the “runnable” state), but actually did not run. The reasons for starvation can be within the Java VM or within the operating system. Most typical situations resulting in starvation are listed below:
•A traditional,
•There were more threads ready to run (within all applications present in the system) than the number of available CPUs.
•The operating system (for example, virtual memory) overhead or failure to schedule the threads “fairly”
•Virtual machine operations, such as class loading, or method
See also: Change Color Selection for Histogram Display (page 185)
Interpreting the Histogram Presentation
You can assess the scalability of the application from the spectrum of a typical “working” thread from your application.
•A large amount of lock contention (red) indicates that scalability will be a problem. You need to change the
•A large amount of waiting (green) may indicate that the load on the application can be increased. This is because in a typical server application the threads use the Java wait method to wait for the data to process.
•A large amount of starvation (white) indicates that the ratio of the active threads to the number of CPUs is too large. You can probably decrease the number of threads without negatively affecting the performance or throughput.
74 Profiling Applications